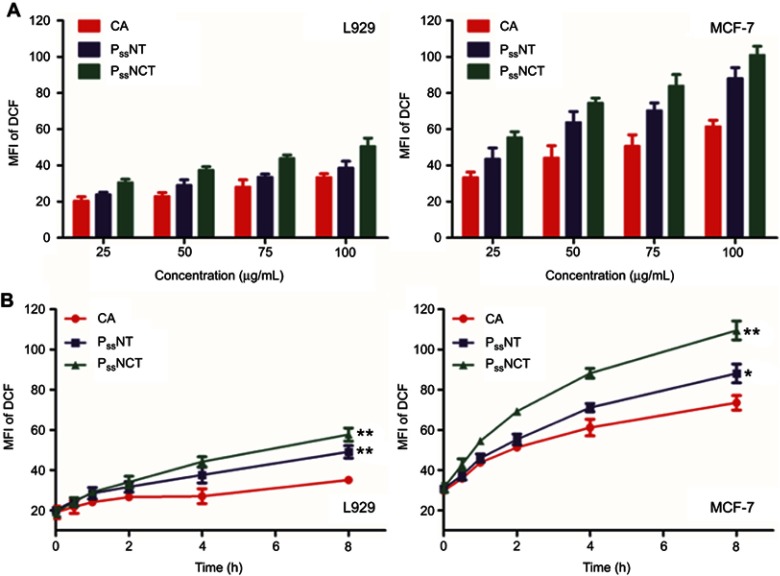
Figure 6.
Changes of ROS levels in L929 and MCF-7 cells after incubating with free CA, PssNT, or PssNCT nanogels in different concentrations (A) or for different periods of time (B) (mean±SD, n=3). The concentrations of PssNT and PssNCT were fixed according to the concentration of CA. *P<0.05, **P<0.01: significantly different from the CA group.

