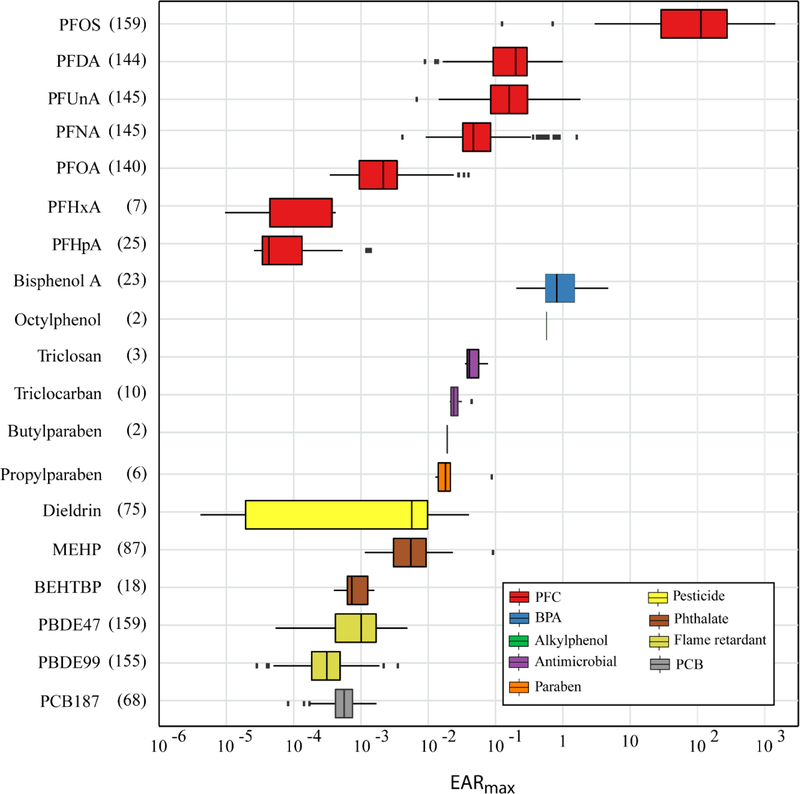
Figure 2.
Chemical summaries of maximum exposure—activity ratios (EARmax) for organic contaminants detected in eaglet plasma collected from six study areas in the upper Midwestern United States, 2006–2015. Values represent the maximum of the sum of EAR for all organic contaminant-endpoint matches for a given chemical within a sample. Numbers in parentheses after chemical name represent the number of sites (eagle nests) at which the chemical was detected. Boxplot whiskers extend to the smaller of the maximum value and 1.5 times the interquartile range, and the larger of the minimum value and 1.5 times the interquartile range. Individual points represent values beyond the ends of the whiskers. PFC, perfluorinated chemical; BPA, bisphenol A; PCB, polychlorinated biphenyl.

