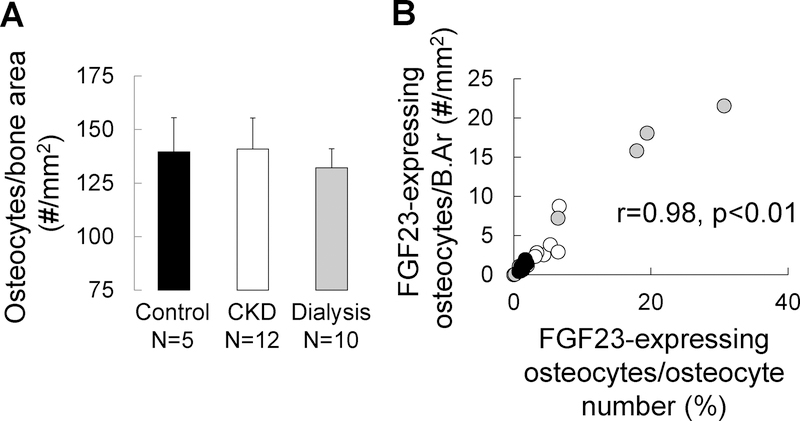
Figure 4: Osteocyte numbers are stable in CKD bone; increased numbers of FGF23-expressing osteocytes reflect an increased proportion of early osteocytes.
(A) The total number of osteocytes in bone, as determined by the number of osteocytes staining for DAPI normalized by bone area, in trabecular bone of 5 pediatric healthy controls, 12 pediatric pre-dialysis CKD patients, and 10 pediatric dialysis patients not receiving active vitamin D sterol therapy. (B) The relationship between numbers of FGF23-expressing osteocytes expressed as a percentage of total, DAPI-positive, osteocytes (X axis) (FGF23-expressing osteocytes/osteocyte number) and the number of FGF23-expressing osteocytes per trabecular bone area (Y axis) (FGF23-expressing osteocytes/B.Ar). Closed (black) circles show represent healthy controls; open circles represent pre-dialysis CKD patients; closed grey circles represent dialysis patients.

