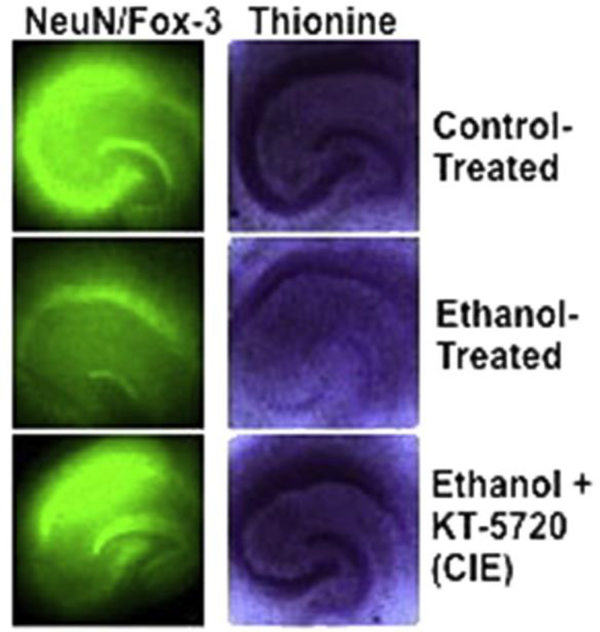
Fig. 8.
Representative images of NeuN/Fox-3 IR (left panel) and thionine staining of Nissl bodies (right panel) in control-treated hippocampi (top row), ethanol-treated hippocampi (middle row), and hippocampi co-exposed to ethanol and KT-5720 (1 mM). The brightness of all representative images has been increased by 20% in Microsoft PowerPoint so as to better visualize hippocampal cell layers.

