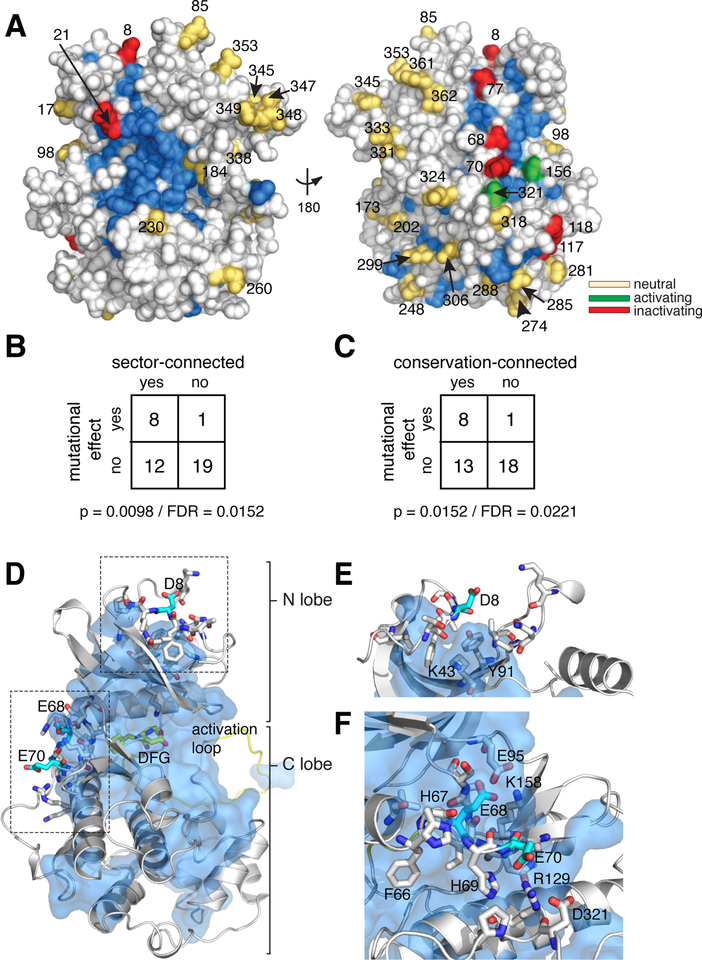
Figure 5. Association of Kss1 D/E mutations with conserved and co-evolving positions.
A. Space filling diagram of a Kss1 homology model (30). The CMGC sector, defined as positions that co-evolve across the CMGC kinases, is indicated in blue. Acidic surface residues with a neutral, activating, or inactivating effect on kinase function upon mutation to alanine are shown as yellow, green or red spheres respectively.
B. Fisher’s exact table demonstrating statistically significant enrichment of acidic surface residues with a functional effect upon mutation at sector-connected positions. To be sector connected, a position must have at least one atom within 4 Å of the sector. Both a p-value and estimated false discovery rate are indicated.
C. Same as for B, but considering conservation-connected rather than sector-connected positions. The cutoff for conservation was chosen to give a similar number of positions as the sector. A detailed analysis of the effect of conservation and sector cutoffs can be found in the supplement.
D. Homology model of Kss1 illustrating the relationship of positions Asp8, Glu68 and Glu70 (cyan sticks) to the sector (blue surface). The kinase backbone is in grey cartoon; the activation loop and DFG active site motif are colored yellow. Residues proximal to Asp8, Glu68 and Glu70 are shown in grey sticks.
E. Close up view of the region surrounding position 8. Color coding follows from D.
F. Close up view of the region surrounding positions 68–70. Color coding follows from E.

