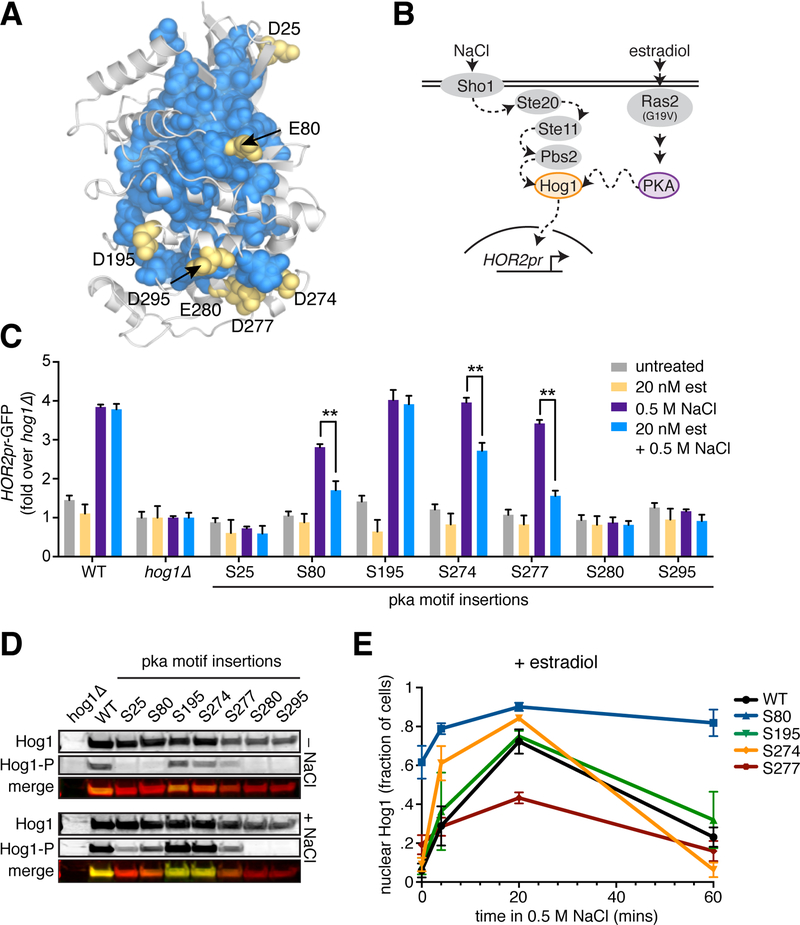
Figure 6. Modulation of Hog1 activation dynamics by introduction of PKA phosphorylation sites at sector edges.
A. Sector-connected D/E residues are indicated on a homology model of Hog1.
B. Schematic of the engineered PKA/Hog1 pathway. Note that the Sln1/Ypd1 branch of the endogenous HOG pathway is omitted for clarity.
C. The 7 Hog1-pka yeast strains along with wild type and hog1Δ controls were grown in the presence and absence of 20 nM estradiol and assayed for activation of the HOR2pr-GFP reporter by flow cytometry following treatment with 0.5 M NaCl for 2 hours. Bars represent the average of the median GFP fluorescence from 3 biological replicates normalized to the untreated hog1Δ cells, and error bars are the standard deviation of the biological replicates. P-values were calculated by one-way ANOVA, ** denotes P < 0.01.
D. Immunoblots probed with anti-FLAG and anti-phospho-p38 antibodies to show total levels of the Hog1-pka mutants and their levels of activation loop phosphorylation under basal conditions and following treatment with 0.5 M NaCl for 15 minutes.
E. Quantification of Hog1-mKate nuclear localization dynamics in wild type and Hog1-pka mutants. Cells were imaged under basal conditions and following 5, 20 and 60 minutes of treatment with 0.5 M NaCl. N > 50 cells for all mutants at all time points.

