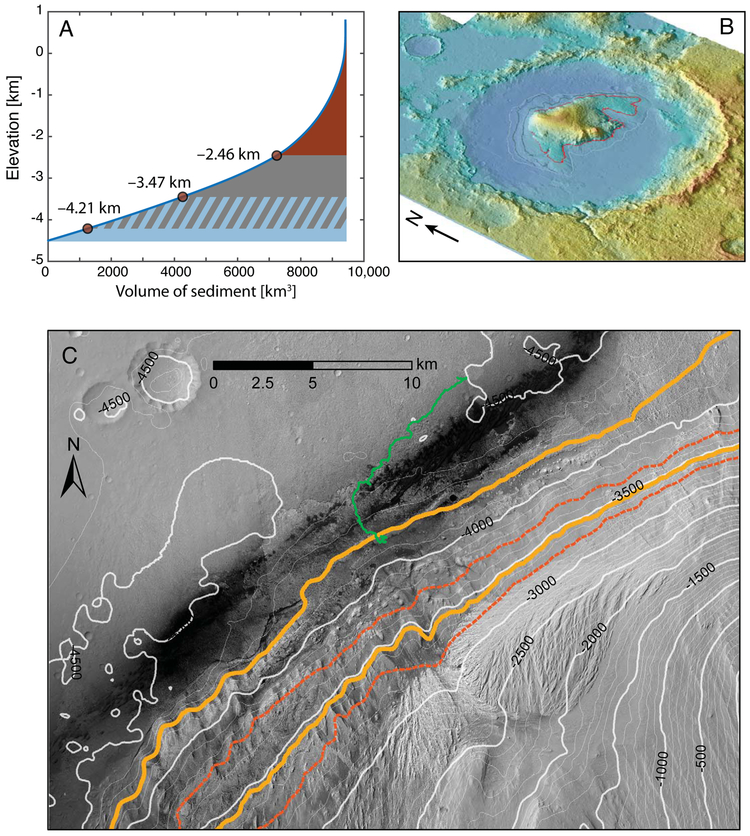
Figure 3.
(a) Cumulative volume of Gale’s mound versus elevation. The total mound volume is 9.41 ×l03 km3 of sediment above the base elevation of −4.5 km. Lower red circles give range of maximum elevation of mounds if it were built from fluvially-transported sediment (−4.21 km to −3.47 km, region shaded in blue). Upper red circle gives elevation of spillover to north at −2.46 km; region shaded in red. (b) Perspective view of Gale crater flooded up to the spillover elevation of −2.46 km. Red contour line is this same elevation of −2.46 km; black contour lines are −3.47 km and −4.21 km, although they are truncated where they intersect the mapped outer boundary of the mound encircled with a white line, (c) Countour map of NW portion of Mt. Sharp; contours are from HRSC h1927_0000. MSL traverse from Sols 1–2313 is given with green line. Solid orange contours are the −4.21 km and −3.47 km elevation boundaries based on the current topography; dashed red contours are the −3.7 km and −3.3 km elevation boundaries using inferred paleotopography.

