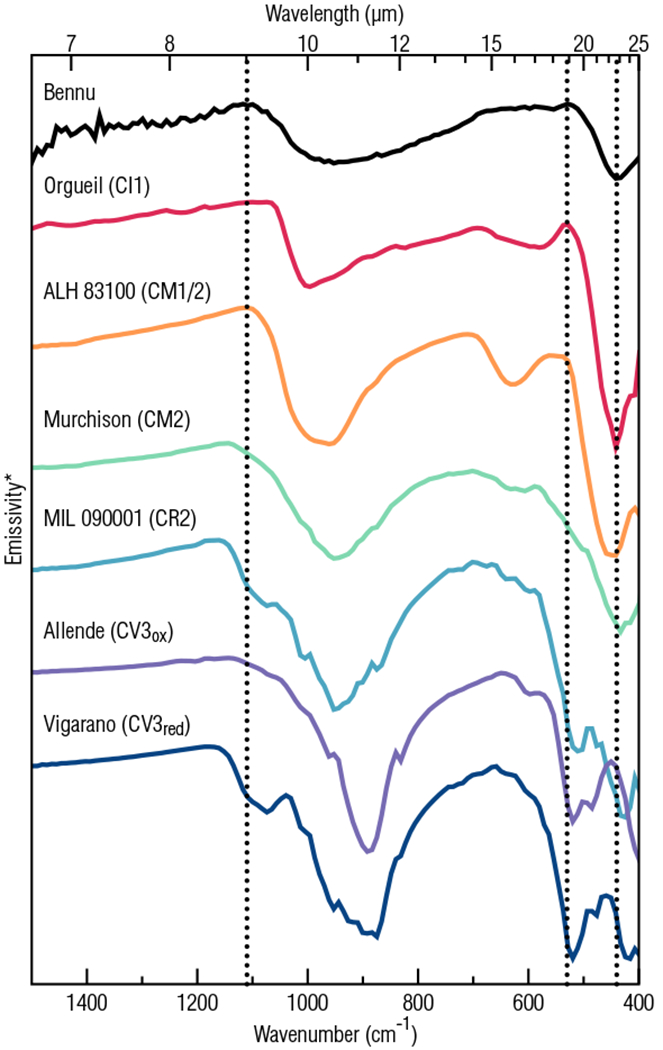
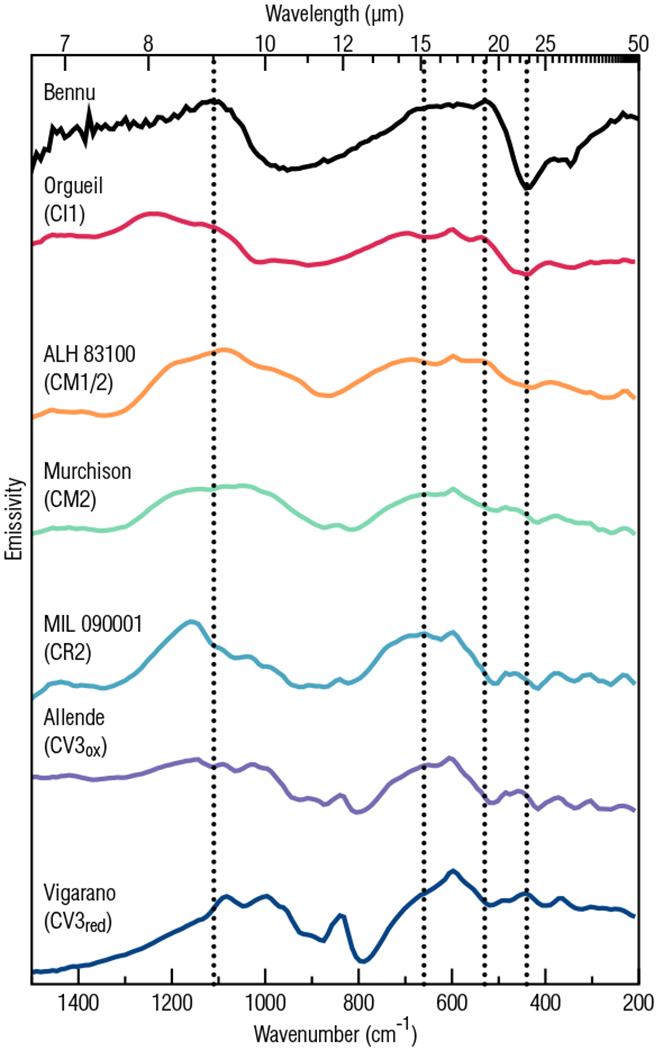
Figure 4. Average OTES spectrum of Bennu compared to spectra of whole-rock and fine-particulate carbonaceous chondrite meteorites.


a, Comparison with whole-rock samples, b, Comparison with fine-particulate (<125 μm) samples. Spectra have been scaled and offset for comparison (see Methods). Vertical lines at 1110 and 530 cm−1 indicate the positions of diagnostic peaks in the Bennu spectrum, and the vertical line at 440 cm−1 denotes a diagnostic absorption.
