
Figure 5. Average OTES Bennu spectrum compared to a spectrum of pure, fine-particulate (<90 μm) magnetite.
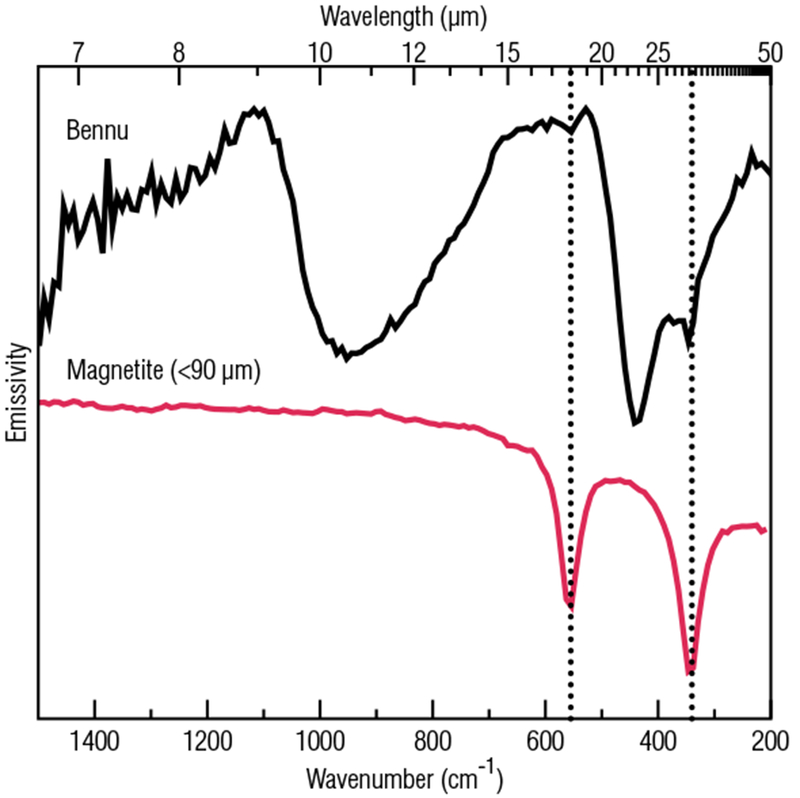
Spectra have been scaled and offset for comparison. Vertical lines at 555 and 340 cm−1 indicate the positions of diagnostic absorptions in both spectra.