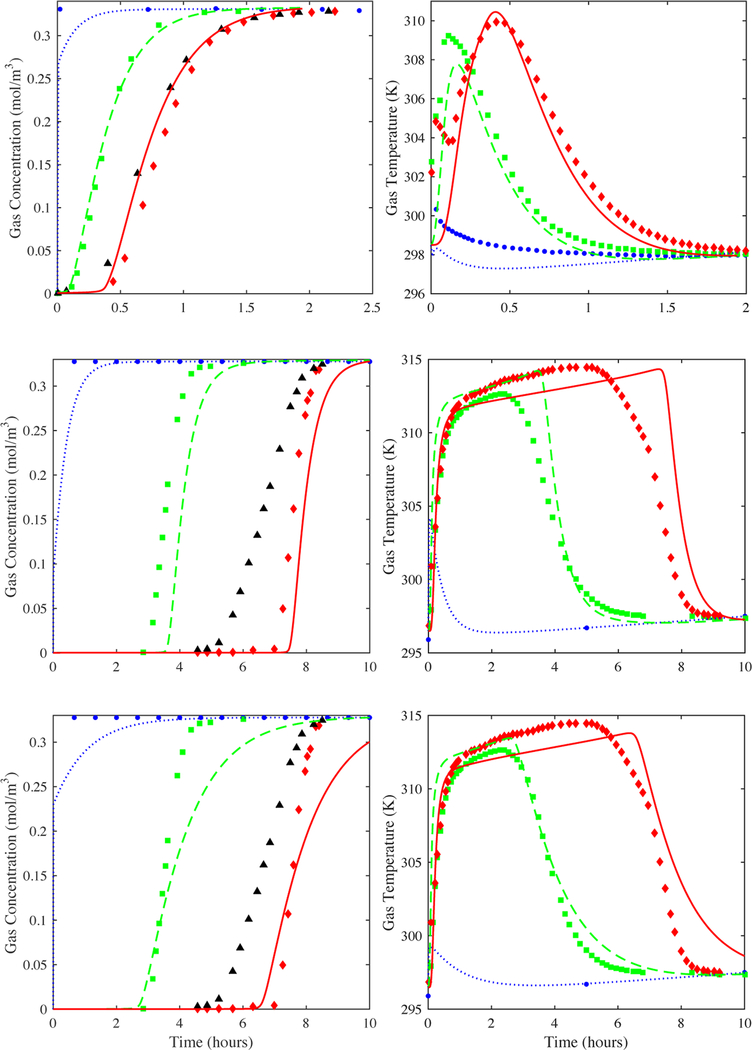
Figure 7.
CO2 on zeolite 5A (top panels): Predictions from the model (lines) shown in Figure 6 of the 2.5% (circles), 50% (squares), and 97.5% location (diamonds) experimental center line gas-phase concentration breakthrough curves but now using the reported saturation term for the CO2-zeolite 5A isotherm (no adjustment), a void fraction of 0.33, the Wakao and Funazkri correlation (eq 10a) for axial dispersion and LDF kn = 0.0023 s−1. The experimental outside the bed (triangles) breakthrough curve is shown for comparison. Predictions from the model (lines) of the 2.5% location (circles), 50% location (squares), and 97.5% location (diamonds) experimental center line temperature profile histories. H2O on zeolite 5A (middle panels): Predictions from the model (lines) shown in Figure 6 of the 2.5% location (circles), 50% location (squares), and 97.5% location (diamonds) experimental center line gas-phase concentration breakthrough curves but now using the reported saturation term for the H2O-zeolite 5A isotherm (no adjustment), a void fraction of 0.33, the Wakao and Funazkri correlation (eq 10b) for axial dispersion and LDF kn = 0.0008 s−1. The experimental outside the bed (triangles) breakthrough curve is shown for comparison. Predictions from the model (lines) of the 2.5% location (circles), 50% location (squares), and 97.5% location (diamonds) experimental center line temperature profile histories. H2O on zeolite 5A (bottom panels): same as middle but now with LDF kn adjusted to kn = 0.0002 s−1 to match the slope of the experimental outside the bed (triangles) breakthrough curve.

