Figure 2.

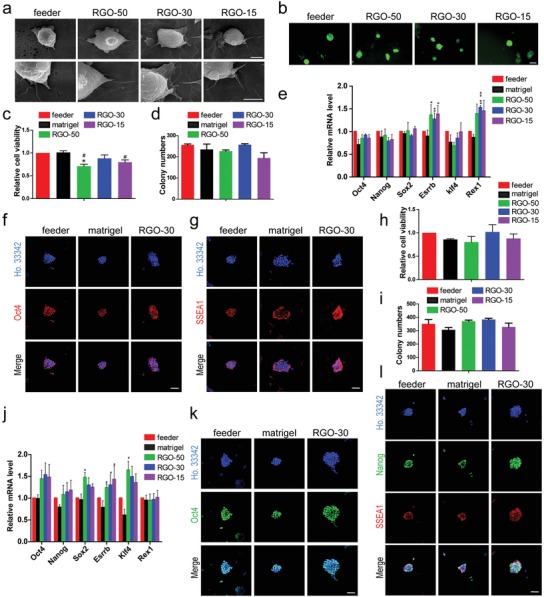
RGO substrate phenocopy feeder cells to support ESC self‐renewal. a) The SEM images with different magnifications of a single cell of NR3 cultured on feeder or RGO substrates for 4 h. Magnifications: 5000 × (the upper line) and 10 000 × (the lower line). Scale bars: 5 µm in the upper line and 4 µm in the lower line. b) Nanog‐green fluorescent protein expressing ESCs (NR3) were cultured on feeder, RGO‐50, RGO‐30, and RGO‐15 substrates for 2 days, respectively. The pictures were taken by a fluorescence microscope. Scale bar: 100 µm. c) The relative cell viability of NR3 on feeder, matrigel, RGO‐50, RGO‐30, and RGO‐15 substrates. # p < 0.05 versus matrigel group and * p < 0.05 versus feeder group. d) The alkaline phosphatase staining of NR3 cultured on feeder, matrigel, and RGO substrates was performed, and the number of positive clones was statistically analyzed. e) The expression levels of pluripotency gene Oct4, Nanog, Sox2, Esrrb, Klf4, and Rex1 of NR3 cultured on feeder, matrigel, and RGO substrates were detected by qRT‐PCR. ## p < 0.01 versus matrigel group and * p < 0.05, ** p < 0.01 versus feeder group. The immunofluorescent staining of f) Oct4 and g) SSEA1 of NR3 cultured on feeder, matrigel, and RGO‐30 substrates. Oct4 and SSEA1 (stage‐specific embryonic antigen 1) are pluripotency marker proteins of mouse ESCs. Scale bar: 50 µm in panels (f) and (g). h) The relative cell viability of 46C on feeder, matrigel, and RGO substrates. i) Alkaline phosphatase assay of 46C cultured on feeder, matrigel, RGO‐50, RGO‐30, and RGO‐15 substrates, and the number of positive clones was counted. j) The expression levels of Oct4, Nanog, Sox2, Esrrb, Klf4, and Rex1 of 46C cultured on feeder, matrigel, and RGO substrates. # p < 0.05 versus matrigel group and * p < 0.05 versus feeder group. The protein levels of k) Oct4, l) Nanog, and SSEA1 expressed by 46C on feeder, matrigel, and RGO‐30 substrates were evaluated by immunofluorescent staining. Scale bar: 50 µm in panels (k) and (l).
