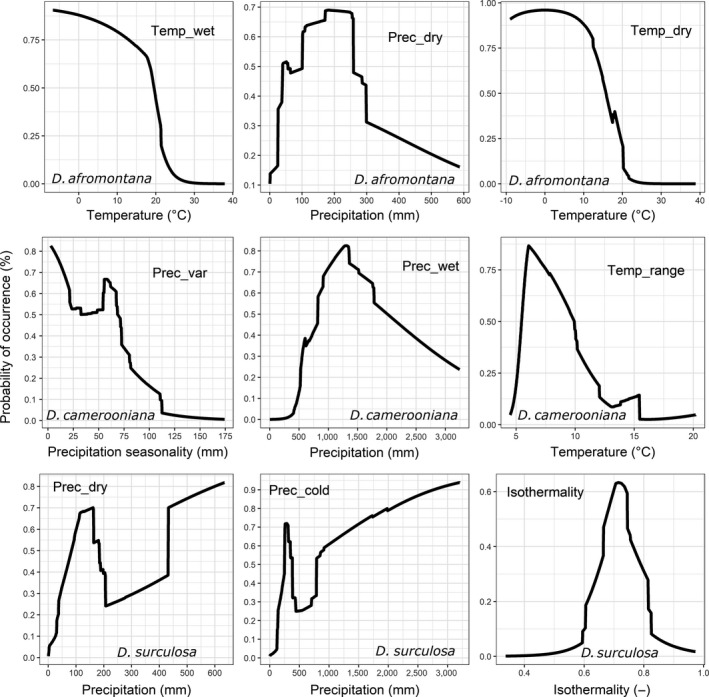
Figure 4.

Partial dependence curves showing the response of Dracaena species to three variables mostly responsible for their spatial distribution (assuming that remaining variables are constant). The higher the probability of occurrence (vertical axis), the more suitable conditions for particular Dracaena species
