
Fig. 3.
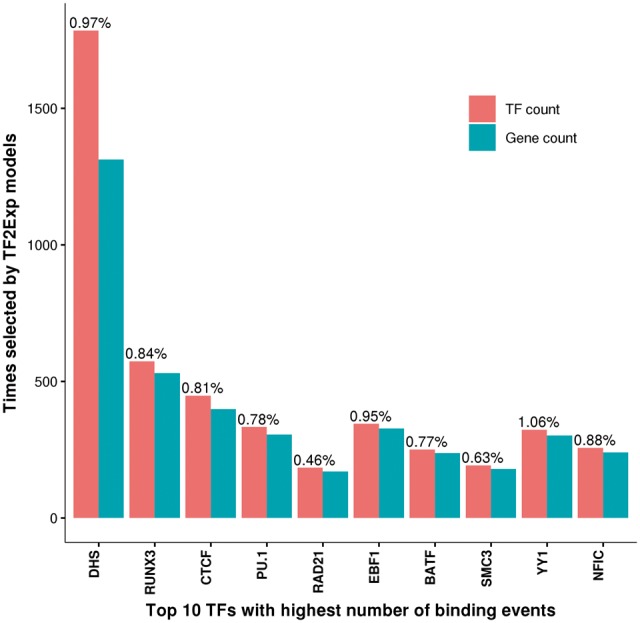
Top 10 TFs with the highest number of binding events and their selection frequency in predictable genes. Red bars indicate the total number of TF-binding events selected by TF2Exp models. Blue bars indicate the total number of genes that selected binding events of the indicated TF as key features. The percentage on top of each red bar indicates the ratio between the number of selected events in TF2Exp models and the total number of peaks for that TF