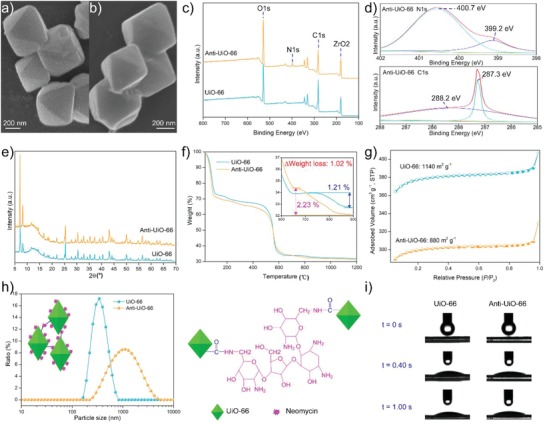
Figure 2.

a,b) SEM images, c) XPS spectra, d) high‐resolution spectra of N1s and C1s of Anti‐UiO‐66, e) XRD patterns, f) TGA curves, g) N2 adsorption–desorption isotherms, h) particle size distributions and cross link of nanoparticles, and i) snapshots of the water contact angle test, of UiO‐66 and Anti‐UiO‐66.
