Figure 1.

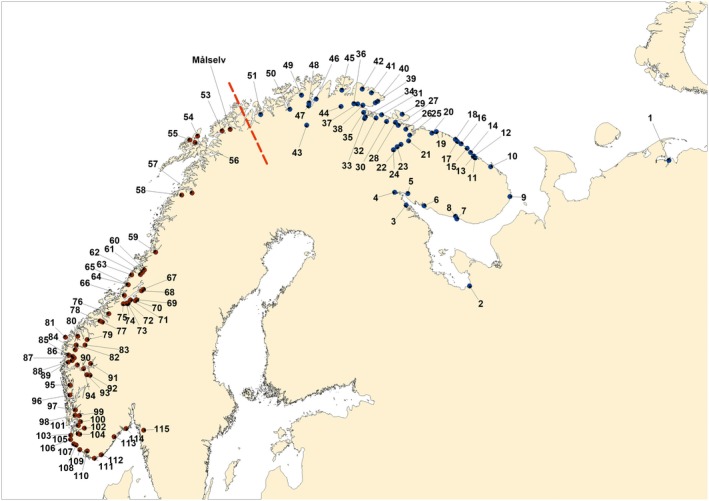
Map showing the location of the rivers sampled in Russia and Norway. Numbers refer to river names in Table A1. The major genetic division of the populations into two groups are indicated with a dashed line

Map showing the location of the rivers sampled in Russia and Norway. Numbers refer to river names in Table A1. The major genetic division of the populations into two groups are indicated with a dashed line