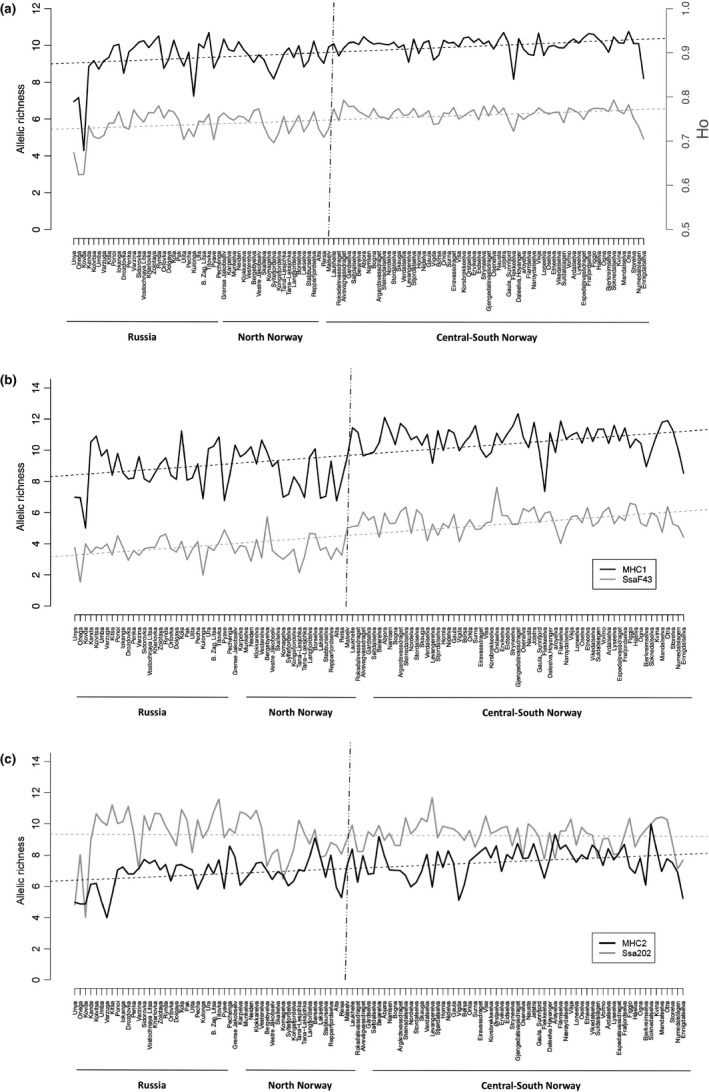
Figure 2.

Patterns of genetic diversity assessed along the coastline from Russia to southern Norway. Genetic diversity was measured as: (a) Ho and overall allelic richness (Ar) per population; and (b) Ar for two out of the eleven loci (Sp1605, SsaF43, MHC1, SsaD486, SSspG7, Ssa14, Ssa289, MHC2, SsaD157, SSsp2210, Ssa197) showing significant trends. (c) Ar for MHC2 and SS202 (the second one showing no significant trend, for the sake of the comparison). Both the overall Ar for the 18 loci (τ = −0.281, p = 9.37e−06) and Ho (τ = −0.255, p < 0.001) experienced a significant decline from south to north. The vertical dashed line shows the first level of STRUCTURE division of the data set
