
Figure 6.
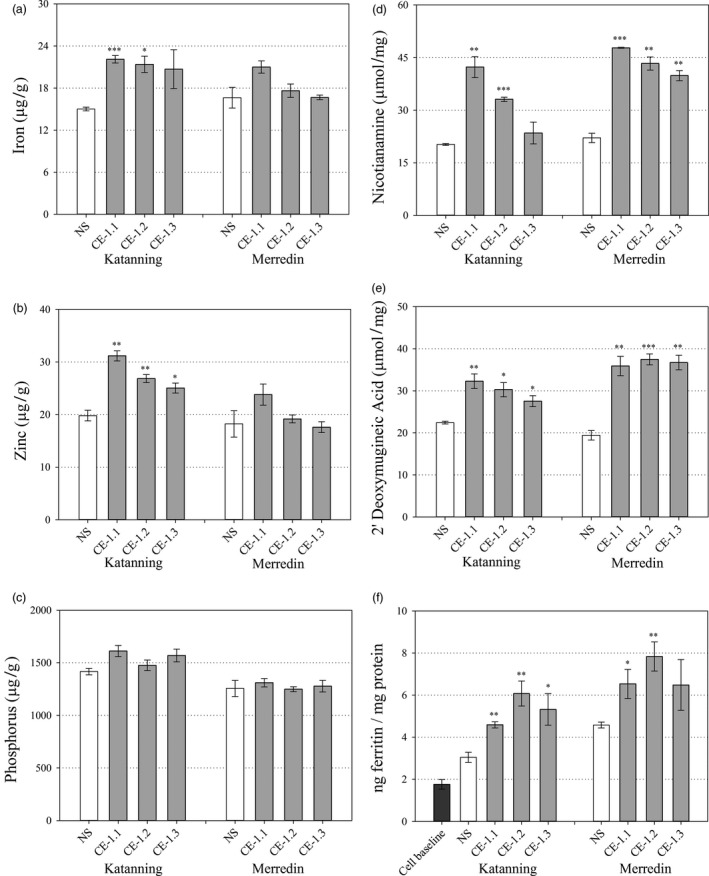
White flour nutrition of field grown CE‐1 and NS wheat lines. Nutrient and metabolite concentrations in white flour samples of NS (white) and three CE‐1 sibling lines (CE‐1.1, 1.2 and 1.3, grey) at the T6 generation. (a–c) White flour Fe, Zn and P concentrations (μg/g) of NS and CE‐1 plants grown at Katanning and Merredin field sites. (d, e) White flour NA and DMA concentrations (μmol/mg) of NS and CE‐1 plants grown at Katanning and Merredin field sites. (f) White flour Fe bioavailability of NS and CE‐1 plants grown at Merredin and Katanning field sites. Bars represent mean ± SEM of 3 biological replicates. Asterisks denote the significance between NS and each CE‐1 wheat line for P < 0.05 (*), P ≤ 0.01 (**), P ≤ 0.001 (***) as determined by student's t‐test.