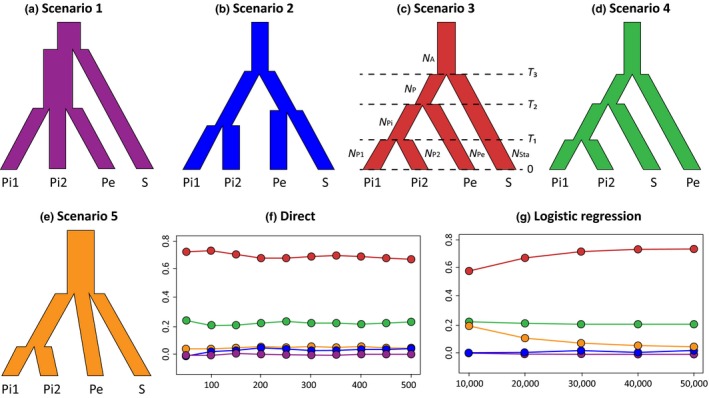
Figure 3.

(a–e) The five scenarios tested in the approximate Bayesian analysis and scenario comparison. Pi1: populations Pra1‐Pra2; Pi2: Populations Pra3‐Pra10; Pe: Pra11; S: Populations Sta1‐Sta8. (f, g) Comparison between the five scenarios. Simulations closest to observation are on the x‐axes and percentages of each scenario are on the y‐axes
