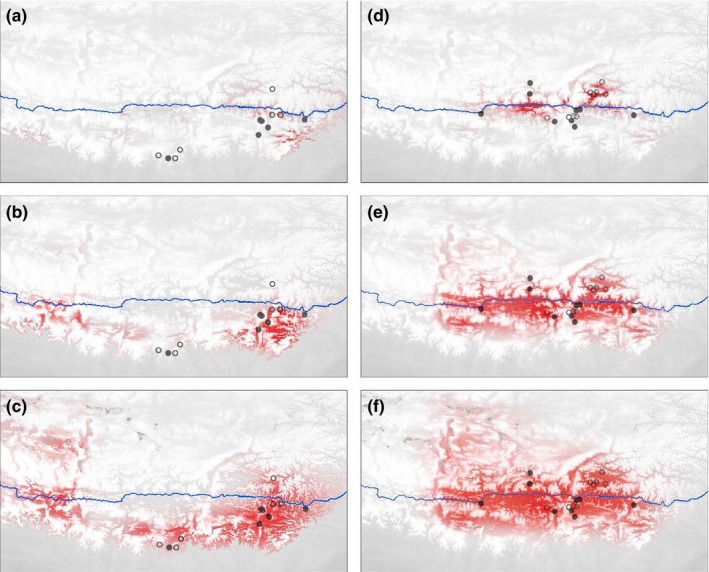
Figure 8.

Predicted distributions of R. stapfii and interior populations of R. prainii. The color density indicates the probability of occurrence. The predicted distributions of R. stapfii during the Last Glacial Maximum (a), mid‐Holocene (b), and current period (c) are shown on the left. The predicted distributions of interior populations of R. prainii during the Last Glacial Maximum (d), mid‐Holocene, (e) and current period (f) are shown on the right. Circles indicate population sites used in species distribution modeling (filled circles indicate sampling sites of this study and open circles represent records collected from online data sets)
