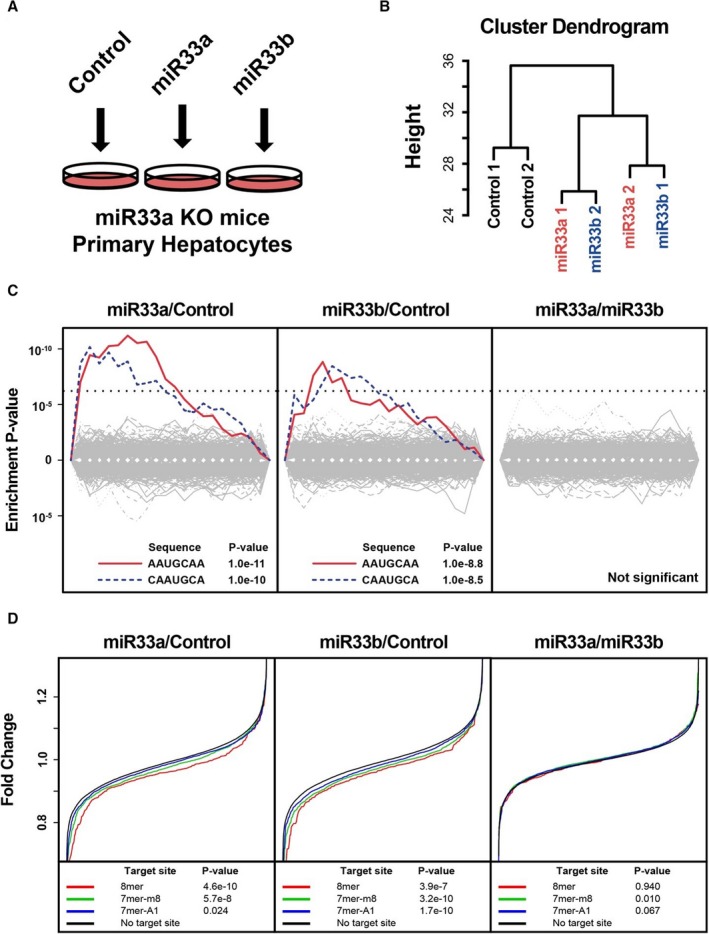
Figure 2.

Transcriptomic analysis of targeting potency and targeting motifs in rodent primary hepatocytes. A, Experimental schema. B, Hierarchal clustering analysis of the expression pattern of primary hepatocytes. MicroRNAs (miR‐33a and miR‐33b) indicate miR‐33a or miR‐33b transfected primary hepatocytes. n=2 for each. C, Significantly suppressed motifs by synthetic miR transfection. miR‐33a vs miR‐control (left), miR‐33b/miR‐control (middle), and miR‐33a/miR‐33b (right). Dotted lines indicate significant threshold after multiple testing correction. D, Suppression of mRNAs with or without miR‐33 target sites in their 3′‐untranslated region. P values were calculated using the Kolmogorov‐Smirnov test. 7‐mer‐A1 indicates CAAUGCA; 7‐mer‐m8, AAUGCAA; 8‐mer, CAAUGCAA; KO, knock out.
