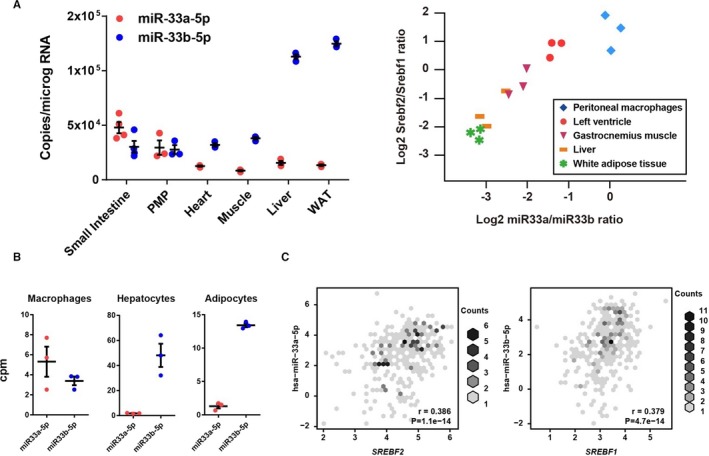
Figure 3.

Organ expression patterns of microRNAs (miR‐33a and miR‐33b) and sterol regulatory element‐binding factor (Srebf) 1 and Srebf2. A, Absolute copy number of miR‐33a and miR‐33b (left) and correlations between the expression ratios of miR‐33a/miR‐33b and Srebf2/Srebf1 in organs of miR‐33b KI mice (right). n=3 for each organ. B, miR‐33 family abundance in human primary culture cells. C, Correlations between Srebf2 and miR‐33a (left) and Srebf1 and miR‐33b (right) expression levels in human primary cultured cells. Pearson's correlation coefficients (r) and P value were shown. Horizontal bars in the dot plots indicate mean±SEM. PMP indicates peritoneal macrophage; WAT, white adipose tissue; cpm, counts per million.
