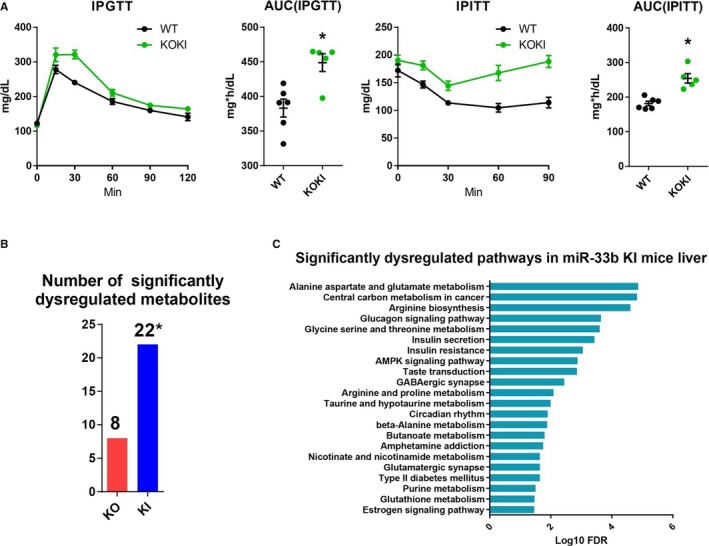
Figure 5.

Impaired glucose tolerance and dysregulated liver metabolites in microRNA (miR)‐33 knock out knock in (KOKI) mice. A, Glucose and insulin tolerance of miR‐33 wild‐type (WT) and miR‐33 KOKI mice. n=6 for WT, and n=5 for KOKI. *P<0.05 compared with WT. B, Number of significantly dysregulated metabolites for miR‐33 knockout mice compared with WT and miR‐33b KI mice compared with WT mice. n=6 for each. *P<0.05 compared with knockout (tested by Fisher's exact test). C, Significantly dysregulated pathways in miR‐33b KI mice liver. Horizontal bars in the line chart or dot plots indicate mean±SEM. AMPK indicates AMP kinase; AUC, area under the curve; FDR, false discovery rate; IPGTT, intraperitoneal glucose tolerance test; IPITT, intraperitoneal insulin tolerance test; KO, Knock out.
