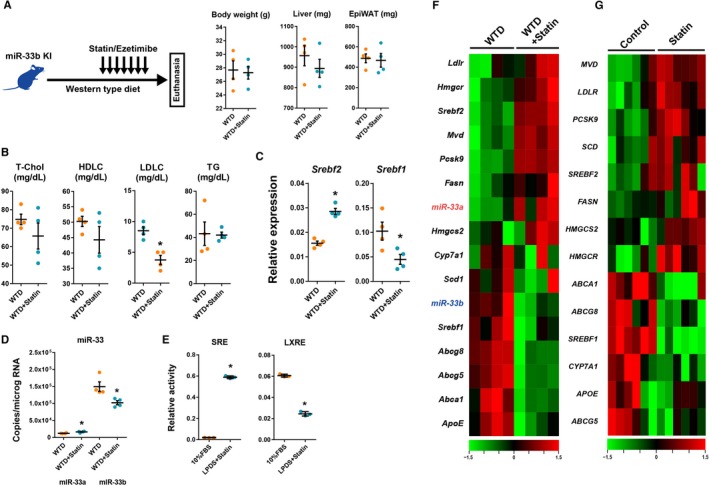
Figure 8.

Changes in liver gene expression in microRNA (miR)‐33b knock in (KI) mice in the cholesterol‐depleted condition. A, Experimental scheme and changes in body liver and epidydimal white adipose tissue (EpiWAT) weight during experiment. B, Serum lipid profiles after 2 weeks of Western‐type diet (WTD) feeding and 1 week of treatment with vehicle or statin/ezetimibe. C and D, Quantitative polymerase chain reaction analysis for sterol regulatory element‐binding factor (Srebf) 2 and Srebf1 (C) and miR‐33a and miR‐33b (D) in the liver under the cholesterol‐depleted condition. n=4 for each. *P<0.05 compared with vehicle. E, Reporter assay containing sterol response element (SRE) and liver‐X‐receptor response element (LXRE) in HepG2 cells. n=3 for each. *P<0.05 compared with fetal bovine serum (FBS) containing medium. F, Heat map representation for liver gene expressions of mice treated with vehicle or statin/ezetimibe. Green indicates low expression level, and red indicates high expression level. n=4 for each. G, Heat map representation of gene expression in vehicle‐ or statin‐treated human primary culture hepatocytes. Data were obtained from GSE24187. n=6 for each. Horizontal bars in the dot plots indicate mean±SEM. HDLC indicates high‐density lipoprotein‐cholesterol; LDLC, low‐density lipoprotein‐cholesterol; LPDS, lipoprotein‐depleted serum; T‐Chol, total cholesterol; TG, Triglyceride.
