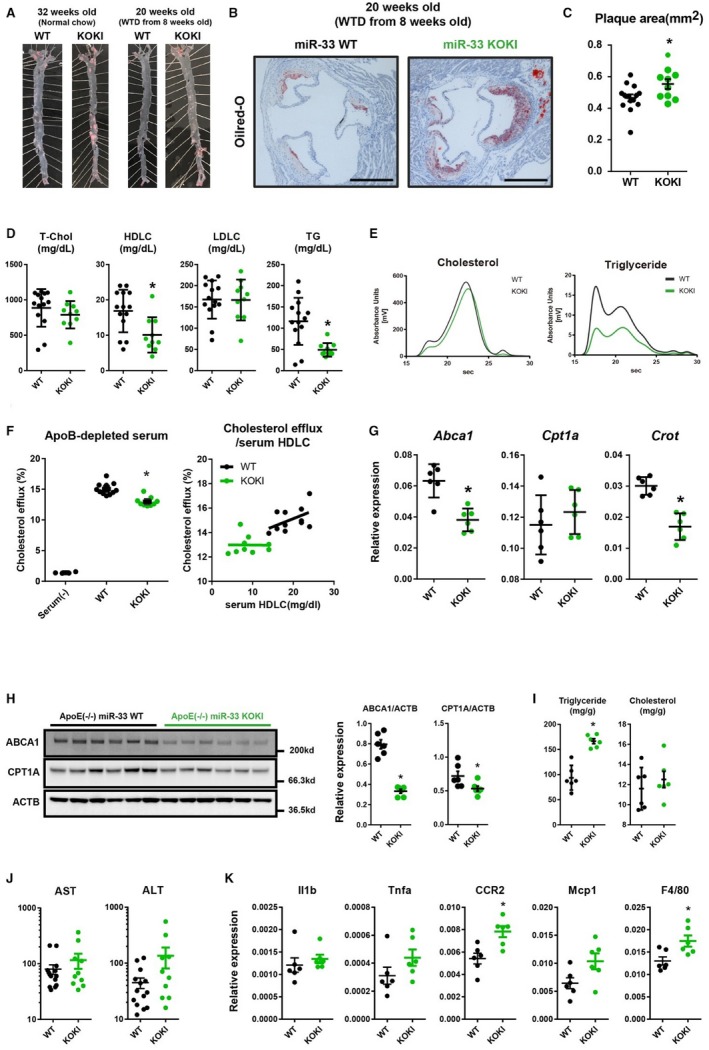
Figure 9.

Increased atherosclerotic plaque burden in apolipoprotein E–deficient (ApoE−/−)/microRNA (miR)‐33 knock out knock in (KOKI) mice. Representative microscopic images of the en‐face analysis of aortic atherosclerotic plaque (A) and proximal aorta (B) in ApoE−/−/miR‐33 wild‐type (WT) mice and ApoE−/−/miR‐33 KOKI mice. Bar=500 μm. C, Quantification of the atherosclerotic plaque area in cross‐sections at the proximal aorta level. D, Serum lipid profiles of ApoE−/−/miR‐33 WT mice and ApoE−/−/miR‐33 KOKI mice. n=14 for WT, and n=10 for KOKI. E, High‐performance liquid chromatography analysis of serum cholesterol and triglyceride levels from ApoE−/−/miR‐33 WT mice and ApoE−/−/miR‐33 KOKI mice. F, Cholesterol extraction properties of serum obtained from ApoE−/−/miR‐33 WT or ApoE−/−/miR‐33 KOKI mice (left) and correlations between serum high‐density lipoprotein‐cholesterol (HDLC) level and cholesterol efflux (right). n=11 for WT, and n=9 for KOKI. G, Quantitative polymerase chain reaction (PCR) analysis for miR‐33 target genes in the liver. H, Western blot analysis for miR‐33 target genes in the liver. β‐Actin is used as loading control. I, Quantifications of triglycerides or cholesterol content in the liver. n=6 for each. J, Serum aspartate transaminase (AST) and alanine aminotransferase (ALT) levels from ApoE−/−/miR‐33 WT and ApoE−/−/miR‐33 KOKI mice. n=14 for WT, and n=10 for KOKI. K, Quantitative PCR analysis for gene expression of inflammatory makers in the liver. n=6 for each. Horizontal bars in the dot plots indicate mean±SEM. ApoB indicates apolipoprotein B; LDLC, low‐density lipoprotein‐cholesterol; T‐Chol, total cholesterol; WTD, Western‐type diet; TG, Triglyceride. *P<0.05 compared with WT.
