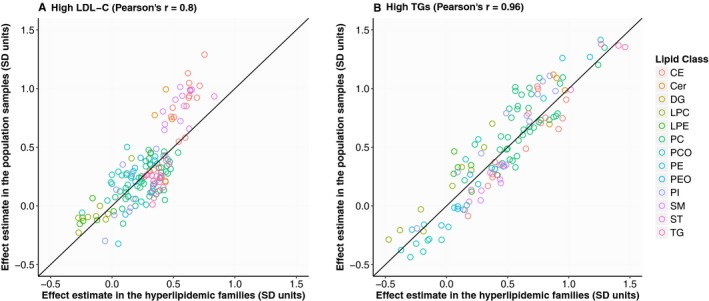
Figure 3.

Correlation of effect estimates for hyperlipidemia status between the hyperlipidemic families and the population samples. The correlation between the effect estimates observed in the family and population cohorts is presented for high low‐density lipoprotein cholesterol (LDL‐C) (effect estimates presented in Figure 2; A) and for high triacylglycerides (effect estimates presented in Figure 4; B). Cer indicates ceramide; DG, diacylglyceride; LDL‐C, low‐density lipoprotein cholesterol; LPA, lysophosphatic acid; LPC, lysophosphatidylcholine; LPE, lysophosphatidylethanolamine; PC, phosphatidylcholine; PCO, phosphatidylcholine‐ether; PE, phosphatidylethanolamine; PEO, phosphatidylethanolamine‐ether; PI, phosphatidylinositol; CE, cholesteryl ester; SM, sphingomyelin; ST, sterol; TG, triacylglyceride.
