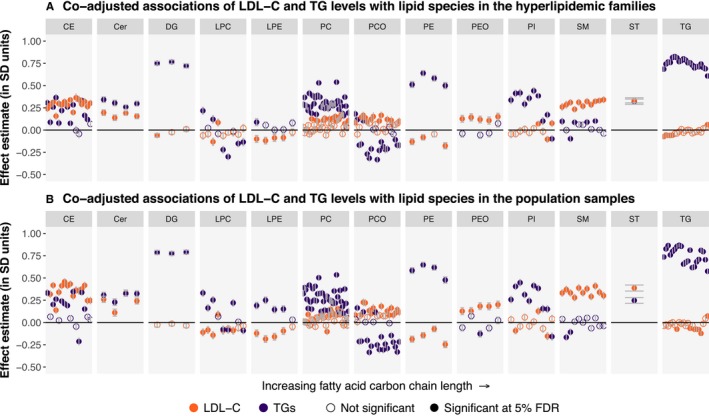
Figure 5.

Independent (coadjusted) associations of low‐density lipoprotein cholesterol (LDL‐C) and triacylglycerides with 151 lipid species. Effect estimates for LDL‐C and triacylglycerides were derived from linear mixed models with the lipid species as outcomes and LDL‐C, log(triacylglycerides), age, age2, and sex as fixed‐effect covariates. The effect estimates were derived separately in the hyperlipidemic families (n=550 individuals; A) and the FINRISK study population cohort (n=897 individuals; B). Effect estimates are presented for LDL‐C in orange and triacylglycerides in purple. Statistical significance was evaluated using the Benjamini‐Hochberg method at a 5% false discovery rate (FDR). The ordering of the lipid species within each class is the same as in Table S7. Cer indicates ceramide; DG, diacylglyceride; FDR, false discovery rate; LDL‐C, low‐density lipoprotein cholesterol; LPA, lysophosphatic acid; LPC, lysophosphatidylcholine; LPE, lysophosphatidylethanolamine; PC, phosphatidylcholine; PCO, phosphatidylcholine‐ether; PE, phosphatidylethanolamine; PEO, phosphatidylethanolamine‐ether; PI, phosphatidylinositol; CE, cholesteryl ester; SM, sphingomyelin; ST, sterol; TG, triacylglyceride.
