Figure 6.

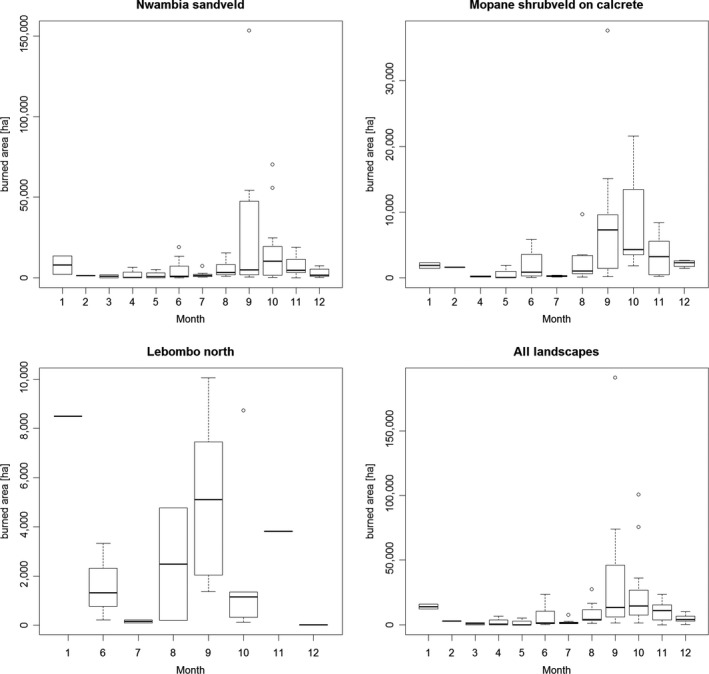
Boxplots of monthly burned area in the different landscapes based on the data from 2003–2013 (Nwambia Sandveld: NS; Mopane Shrubveld on Calcrete: C and Lebombo North: LN)

Boxplots of monthly burned area in the different landscapes based on the data from 2003–2013 (Nwambia Sandveld: NS; Mopane Shrubveld on Calcrete: C and Lebombo North: LN)