
Figure 2.
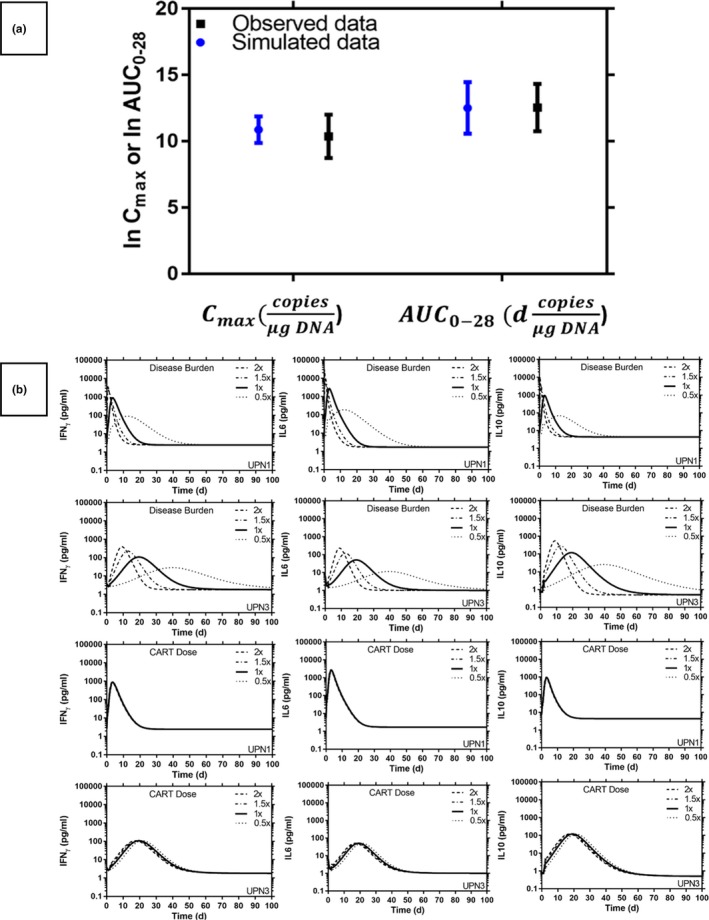
(a) External validation for the final quantitative systems pharmacology (QSP) model using the mean maximal concentration of chimeric antigen receptor T‐cell (CART) peak plasma concentration (Cmax) and the mean area under the curve of the time‐concentration curve from t = 0 to t = 28 days (AUC 0–28) of the typical kinetics of CART in chronic lymphatic leukemia (CLL). Symbols and bars represent the predicted and observed log‐transformed mean and SD values. (b) Simulated CART and cytokine kinetic profiles with different B‐cell disease burden and anti‐CD19 CART doses in a patient with CLL, CART baseline in peripheral blood (PB): 1.1 × 10⁹ cells (UPN1) and 1.4 × 10⁷ cells (UPN3), disease burden baseline in PB: 4.14 × 10⁹ cells (UPN1) and 9.3 × 10⁸ cells (UPN3). IFNγ, gamma interferon; IL, interleukin.