Figure 2.

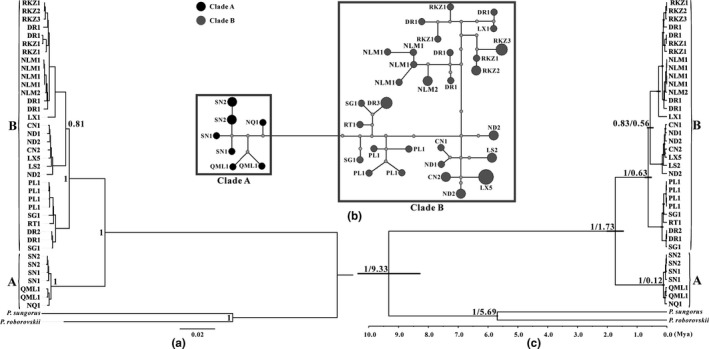
Bayesian tree, haplotype network and chronogram are estimated by the haplotypes of C. kamensis. (a) Consensus tree constructed with the concatenated haplotypes (mtDNA + nuDNA) of C. kamensis using Bayesian inference. The posterior probabilities are indicated at the major inner nodes, and population names are provided in Table 1. The two major lineages are denoted by A (from the east and north of the QTP) and B (from the south and southwest of the QTP). (b) Median‐joining network of C. kamensis infer from the combined mtDNA haplotypes. Circle sizes are proportional to the number of individuals that share the same haplotypes. The missing haplotypes in the network are represented by gray dots. The circle name is the haplotype of different locations and the number of shared haplotypes. Evolutionary clades correspond to the two major clades in Figure 2a. (c) A chronogram of C. kamensis is estimated by the concatenated haplotypes using the Bayesian strict clock (using the estimated mutation rate) in BEAST. Branch lengths represent the mean values of the posterior distribution. The node bars indicate the posterior probability distribution of the node age under the 95% CI. The posterior probability value and divergence time are indicated at each node. The two major lineages are denoted by A and B in line with the Bayesian tree
