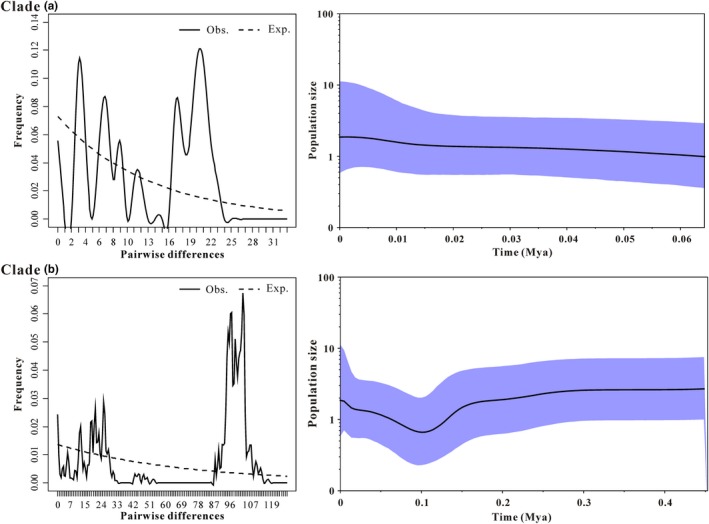
Figure 3.

Demographic history of C. kamensis infers from the concatenated mtDNA haplotypes. (a) Diagrams of mismatch distributions for two major lineages. The solid line indicates the observed frequency of pairwise nucleotide differences between sequences, and the dashed line indicates the expected distribution based on a model of sudden population expansion. (b) Bayesian skyline plots for two major clades of C. kamensis. The black line represents the median estimated population size, and the blue‐shaded areas represent the 95% confidence interval of HPD analysis in the BSP
