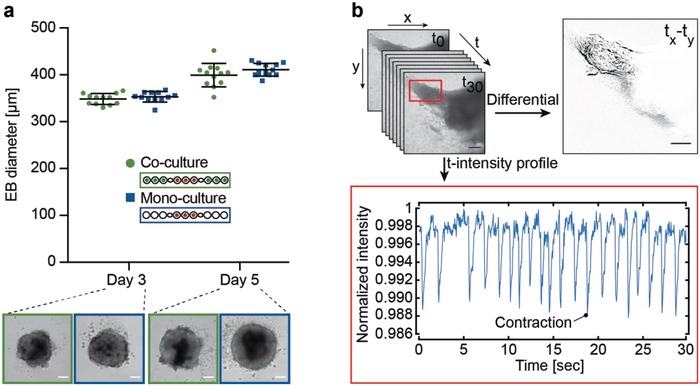
Figure 5.

Functional characterization of embryoid‐body (EB) differentiation. a) Measurements of EB diameters on chip under coculture (green) and monoculture (blue) conditions at day 3 and 5; mean ± SD, n = 12 EBs per condition. Representative bright‐field images are shown for each condition; scale bar: 100 µm. b) Functional readout of beating cardiomyocytes. An example beating trace of an EB at day 10 was captured by recording during 30 s (Movie S2, Supporting Information). A differential image was generated through image subtraction of two subsequent images at contraction and relaxation ( tx–ty). The intensity profile of mean gray values of every time‐lapse acquisition in the area of contraction evidences the beating intervals and frequency during 30 s; scale bar: 200 µm.
