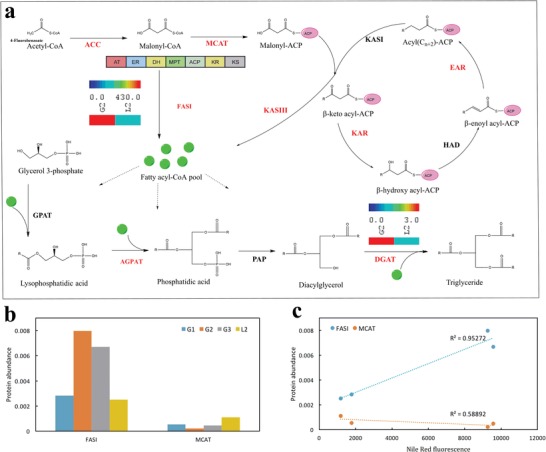
Figure 4.

Proteomics‐based systematic analysis of lipid biosynthesis pathway in R. opacus PD630. a) The lipid biosynthesis pathway reconstructed based on KEGG. The proteins highlighted in red were detected by the proteomics, and those in black were found from genome but not detected by proteomics in this study. The heatmap showed the enzyme expression abundance between G2 and L2. b) The protein abundance of FASI and MCAT under different conditions. The abundance on Y‐axis was presented as their percentage of total normalized peptide counts based on proteomics analysis. c) The correlation efficiency between the protein abundance of FASI or MCAT and lipid accumulation rate. The lipid accumulation was indicated by the increase of Nile Red fluorescence signal under the same condition used for proteomics analysis. The proteins presented in this figure were: AGPAT, 1‐acylglycerol‐3‐phosphate acyltransferase; DGAT, diacylglycerol acyltransferase; EAR, enoyl‐ACP reductase; FASI, type I fatty acid synthase; GPAT, glycerol‐3‐phosphate acyltransferase; HAD, beta‐hydroxyoctanoyl‐acyl carrier protein dehydrase; KAR, 3‐oxoacyl‐[acyl‐carrier‐protein] reductase; KASI, beta‐ketoacyl‐acyl carrier protein synthetase I; KASIII, 3‐oxoacyl‐[acyl‐carrier‐protein] synthase III; MCAT, malonyl CoA‐acyl carrier protein transacylase; PAP, phosphatidic acid phosphatase.
