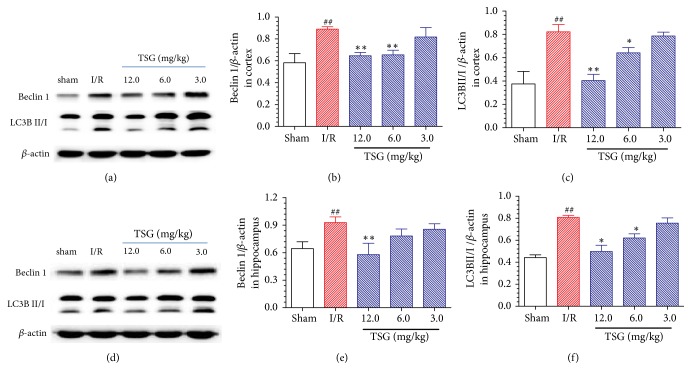
Figure 4.
Effect of TSG on the expression of Beclin 1 and LC3B in cortex and hippocampal tissues of ischemic penumbra in I/R mice. (a) Typical Beclin 1 and LC3B protein expression in the brain tissue cortex of each group. (b) Semiquantitative analysis results of Beclin 1 protein expression in brain tissue cortex. (c) Semiquantitative analysis results of the LC3BII/I ratio in brain tissue cortex. (d) Typical Beclin 1 and LC3B protein expression in the brain tissue hippocampus of each group. (e) Semiquantitative analysis results of Beclin 1 protein expression in brain tissue hippocampus. (f) Semiquantitative analysis results of the LC3BII/I ratio in brain tissue hippocampus. Data are mean±SEM (n=5). ##p<0.01 compared with sham group. ∗∗p<0.01 compared with I/R group.

