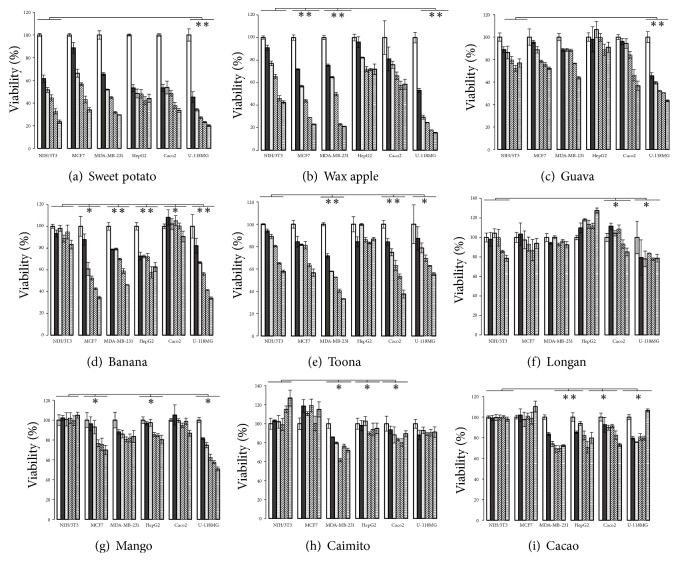
Figure 2.
Cytotoxicity of chlase-treated ethanol crude extracts on NIH/3T3, MCF7, MDA-MB-231, Hep G2, Caco2, and U-118MG cells determined by MTT assays. The cells (5 × 10⁴/well) were stimulated with different doses of chlide (50, 80, 100, 150, and 200 μg/mL). The bars represent the percentage growth inhibition of cells. All measurements made in 96-well plates were carried out using five technical replicates. When compared with the control, the results were statistically significant (∗P<0.05, ∗∗P<0.01, and ∗∗∗P<0.001).

