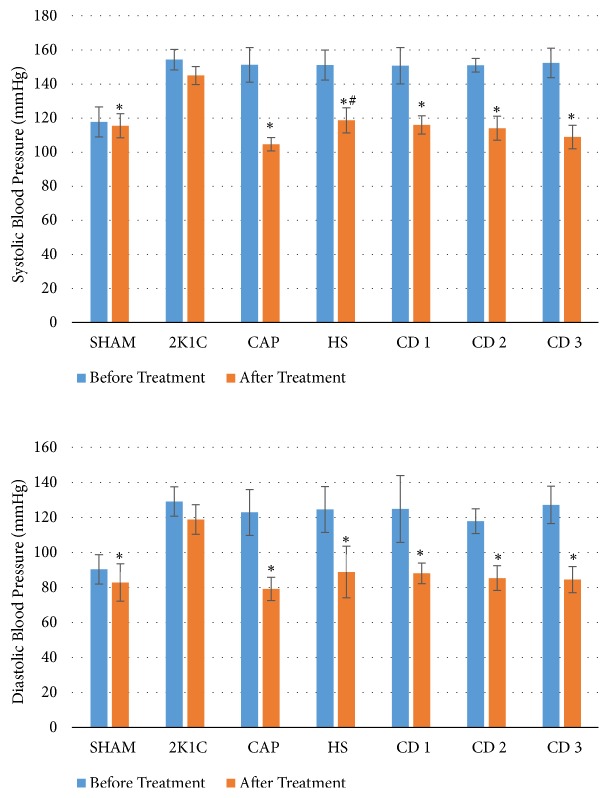
Figure 2.
Blood pressure values before and after drug treatment (n = 6 rats/group). ∗P < 0.05 compared to the 2K1C group; #P < 0.05 compared to the CAP groups. SHAM: normal control; 2K1C: negative control (no treatment); CAP: positive control (4.5 mg/200 g BW captopril; p.o.); HS: Hibiscus sabdariffa extract (30 mg/200 g BW; p.o.); CD 1: coadministration of dose 1 (Hibiscus sabdariffa extract 15 mg/200 g BW + captopril 4.5 mg/200 g BW; p.o.); CD 2: coadministration of dose 2 (Hibiscus sabdariffa extract 30 mg/200 g BW + captopril 4.5 mg/200 g BW; p.o.); CD 3: coadministration of dose (Hibiscus sabdariffa extract 60 mg/200 g BW + captopril 4.5 mg/200 g BW; p.o.).

