Figure 2.

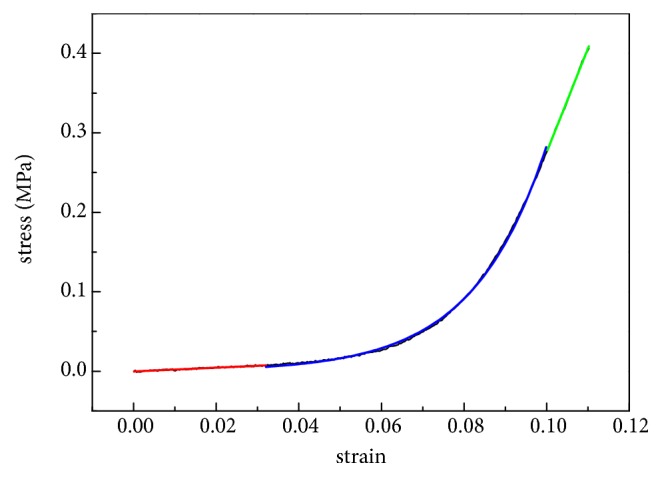
Stress-strain curve of corneal strip and regional division for the curve. The red, green, and blue line represent the physiological range, higher stress state, and nonlinear range, respectively.

Stress-strain curve of corneal strip and regional division for the curve. The red, green, and blue line represent the physiological range, higher stress state, and nonlinear range, respectively.