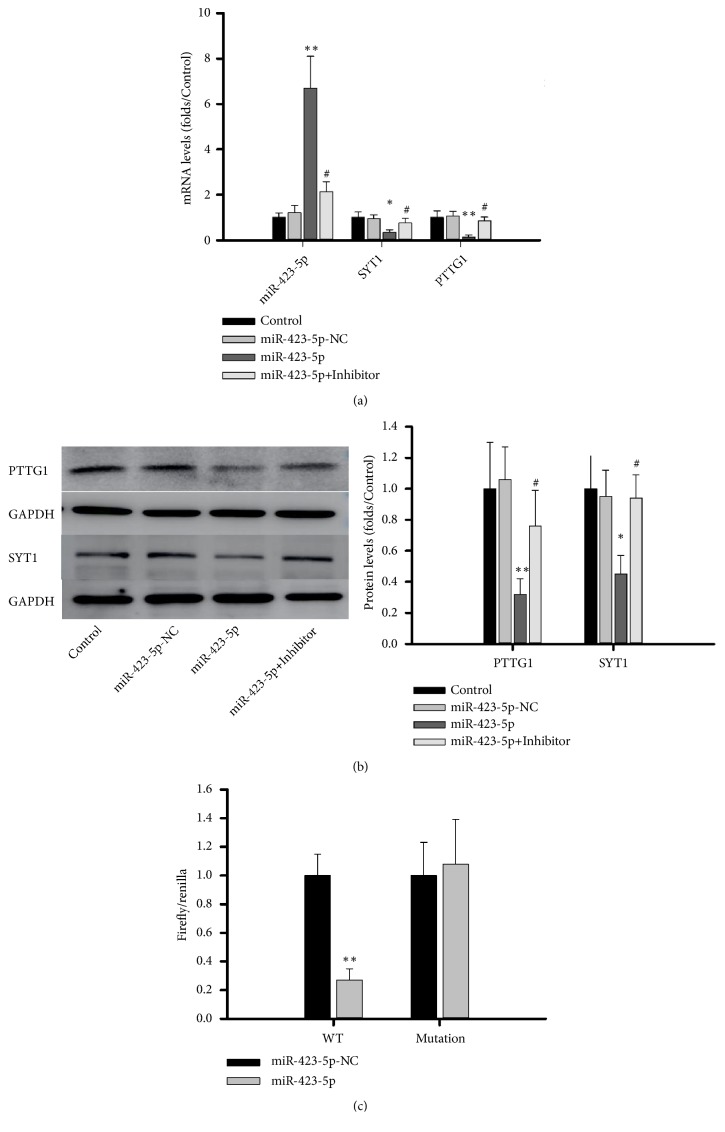
Figure 4.
miR-423-5p inhibited expression of PTTG1 and SYT1 in GH3 cells. (a): mRNA levels of PTTG1 and SYT1 after 48h transfection. (b): Protein levels of PTTG1 and SYT1 after 48h transfection. (c): The activity of firefly/renilla after 48h transfection of PTTG1 wild-type or mutation plasmid. ∗ compared to control group ∗p < 0.05 ∗∗p < 0.01, #compared to miR-423-5p, p<0.05, n = 3.

