Figure 2.
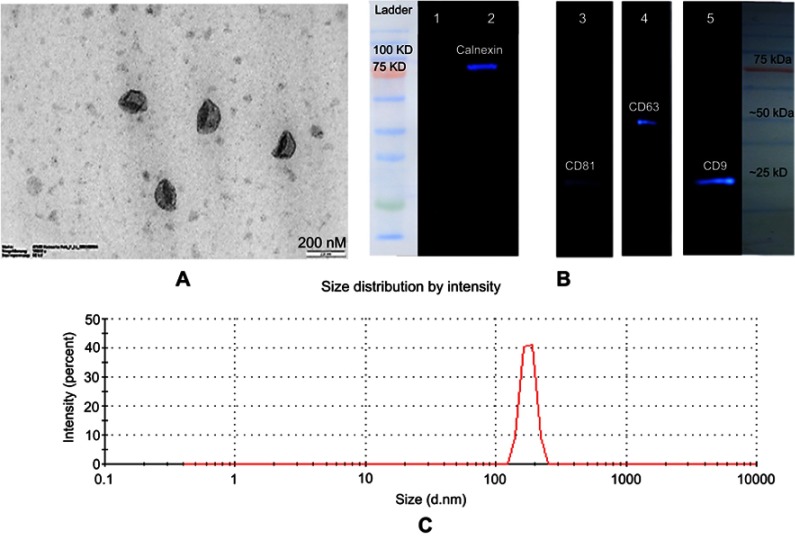
Characterization of exosomes. (A) TEM images of exosomes. Typical structure of exosomes was shown in this image (scale bar 200 nm). (B) Characterization of exosomes by ECL Western blotting. Exosome preparations were negative for endoplasmic reticulum marker (calnexin) in lane 1; lane 2 is the cell lysate which is positive for calnexin. The positive results for exosomal markers are displayed in lane 3 (CD81), lane 4 (CD63), and lane 5 (CD9). (C) Size distribution of exosomes was measured by a zeta-sizer. The peak diameter was about 100 nm.
Abbreviations: ECL, enhanced chemiluminescence; TEM, transmission electron microscopy.

