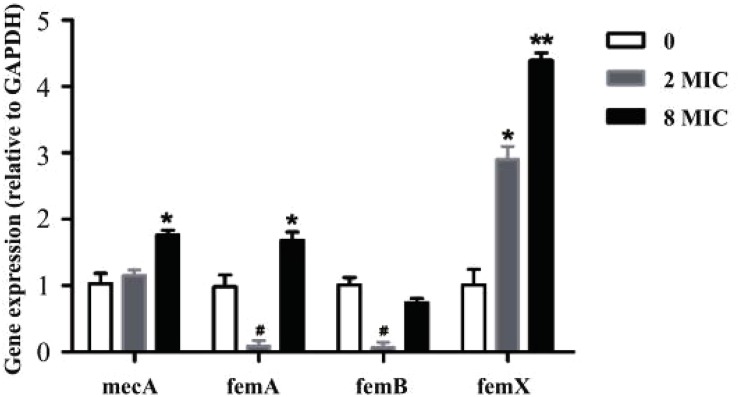
FIGURE 5.
Real-time quantitative PCR results based on experiments performed on control and different resistant genes from S. aureus. Data are presented as fold changes between susceptible strain (white), filtrate from 2MIC (gray), and 8MIC (black) resistant strains (n = 3, asterisk* represents upregulation, 0.01 < p < 0.05 and ∗∗p < 0.01, hatch mark # represents downregulation 0.01 < p < 0.05).

