
Figure 3.
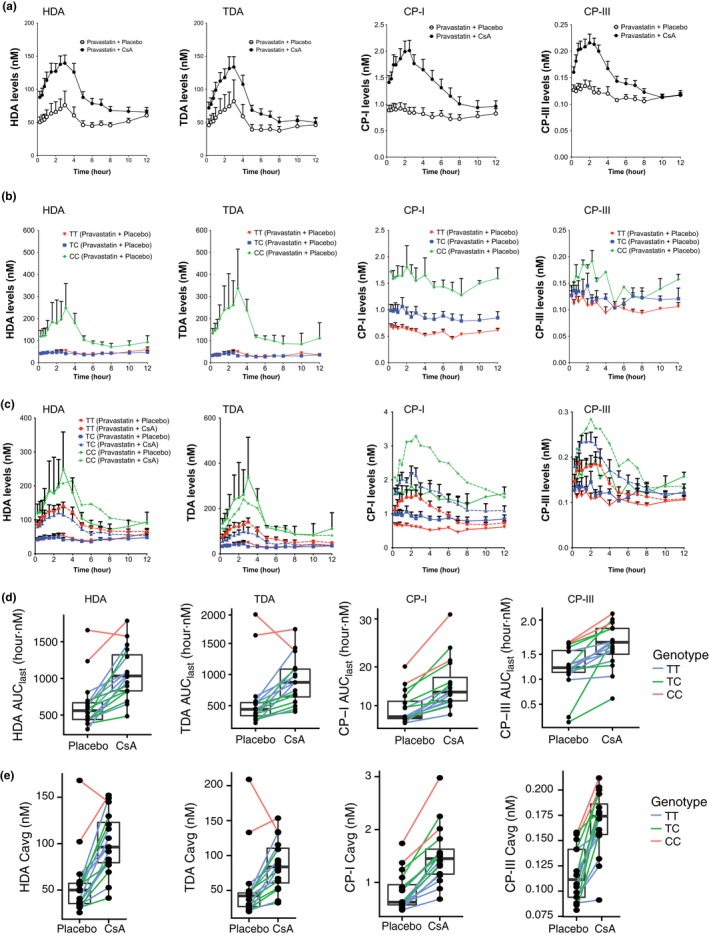
Plasma levels of organic anion‐transporting polypeptide (OATP)1B1 biomarker in carriers of the SLCO1B1 c.521T>C allele and the influence of SLCO1B1 c.521T>C genotype on OATP1B1 biomarker levels and on the effects of cyclosporin A (CsA). Plasma concentration–time profiles of the four OATP1B1 biomarkers in (a) pravastatin plus placebo and pravastatin plus CsA administration; in (b) pravastatin plus placebo administration separated by SLCO1B1 c.521T>C genotype; in (c) pravastatin plus placebo and pravastatin plus CsA administration separated by SLCO1B1 c.521T>C genotype. OATP1B1 biomarkers (d) area under the concentration–time curve from time of administration up to the time of the last quantifiable concentration (AUC 0–last (0–12 hour)) and (e) Cmax of each individual in the pravastatin plus placebo and pravastatin plus CsA group separated by SLCO1B1 c.521T>C genotype (TT, TC, and CC). Each line connects the same individual who did the crossover study. Data in a–c are presented as mean ± SEM. Solid lines in c represent levels from pravastatin plus placebo administration and dashed lines represent levels from pravastatin plus CsA administration. Cavg, average plasma concentration; Cmax, peak plasma concentration; CP, coproporphyrin; HDA, hexadecanedioate; TDA, tetradecanedioate.