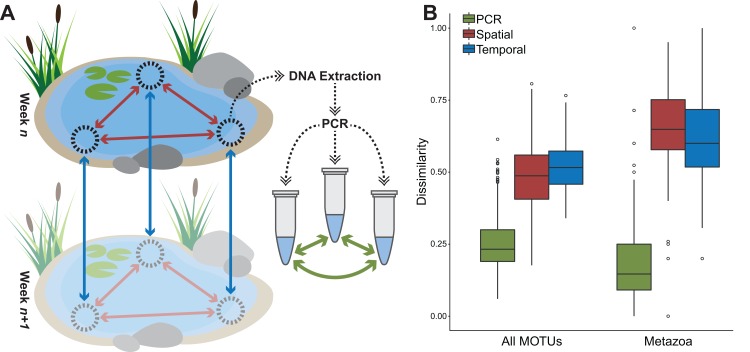
Figure 3. Average dissimilarities between PCR replicates, spatial replicates, and temporal replicates.
(A) Schematic representation of the replicate sampling strategies and (B) boxplot displaying Sørenson dissimilarity values for PCR replicates (green, n = 352 for all MOTUs, n = 344 for metazoa), spatial sampling replicates (red, n = 104) and temporal replicates separated by 1 week (blue, n = 100) for both all MOTUs and metazoan-only MOTUs. In both cases, the dissimilarity between spatial replicates was significantly higher than between PCR replicates (t-test, p = 0.005). Only in the case of all MOTUs was the temporal dissimilarity significantly higher than the spatial dissimilarity (t-test, p = 0.005). There was no significant difference between spatial and temporal dissimilarities in the metazoan-only for samples taken 1 week apart.

