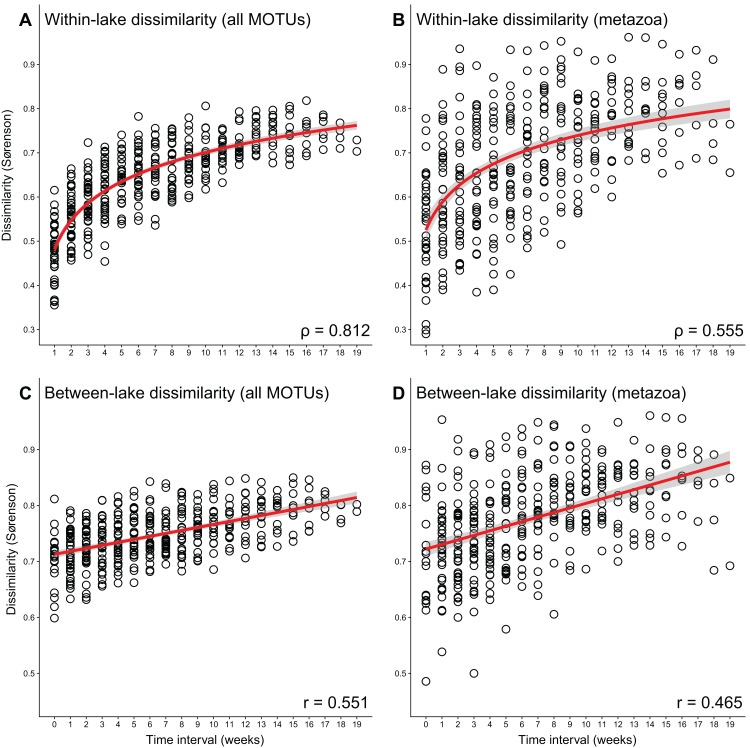
Figure 4. Correlations between time interval and sample dissimilarity.
Time interval between two sampling moments vs. the Sørenson dissimilarity between total communities for samples taken in the same lake, with (A) all MOTUs and (B) only metazoan MOTUs (Spearman correlation, p < 0.001), and time interval between two sampling moments vs. the Sørenson dissimilarity between total communities for samples taken in different lakes, with (C) all MOTUs, and (D) only metazoan MOTUs (Pearson correlation, p < 0.001) (with 95% confidence interval). Correlation values are provided in the panels. Sampling replicates are merged into one sample per location per week, PCR replicates are processed using the “additive” strategy.

