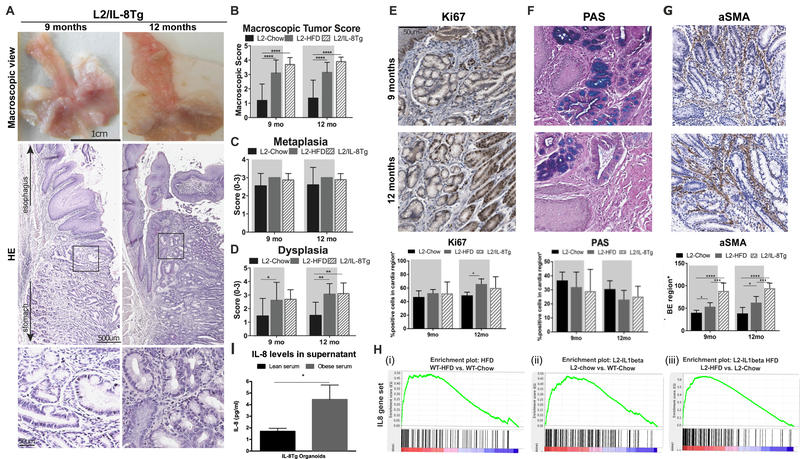
Figure 3. IL8 is one of the key cytokines that accelerates esophageal dysplasia in HFD mice.
(A) Representative macroscopic pictures and Haematoxylin & Eosin (H&E) staining and (B) macroscopic tumor score in L2-IL1B/IL8Tg mice (n=10). (C) metaplasia and (D) dysplasia score in mice (n=8, mean ± SD). (E) Ki67 (F) PAS and (G) a-SMA+ staining in L2-IL1B/IL8Tg mice (n=6, mean ± SEM). (H) Gene Set Enrichment Analysis (GSEA): Differential expression between (i) WT HFD and Chow mice, (ii) L2-IL1B and WT Chow mice and (iii) L2-IL1B HFD and Chow mice (n=3) and analyzed with IL8 gene set, generated by utilizing gene expression data from L2-IL1B/IL8Tg mice and L2-IL-1β mice (n=3, mean ± SEM). (I) 3D mouse BE organoids from L2-IL1B/IL8Tg mice co-cultured with human lean or obese serum (pooled from 10 patients) for 48 hours. (****p<0.0001, ***p<0.001, **p<0.01, *p<0.05) For (B-D) a 2 way Anova with Sidak-Holm post-hoc was used. (E-G) use a 1 way Anova with Tukey post-hoc. (I) uses a t-test. L2=L2-IL-1β, L2/IL8Tg=L2-IL-1β/IL8Tg, HFD=High fat diet.

