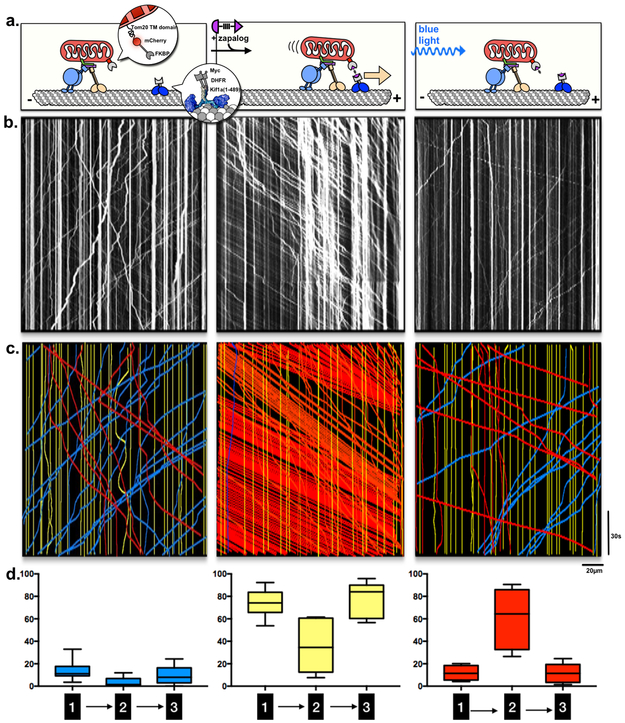
Figure 3. The mitochondrial motor complex retains its activity in the wake of induced translocation.
a, Schematic illustration of zapalog-induced mobilization of axonal mitochondria that shows three phases of the experiment that correspond to the kymographs below:
1. E18 rat hippocampal neurons are transfected with mitochondrial Tom20-mCherry-FKBP and the constitutively active kinesin motor Kif1a(1-489) tagged with DHFR-Myc (enlarged in inserts). Mitochondrial motility is governed by their normal motors and anchors.
2. Addition of zapalog induces attachment of the Kif1a motors to mitochondria and consequently mitochondria are dragged towards the (+) ends of microtubules.
3. Exposure to 405nm light causes the exogenous motors to detach immediately and completely from mitochondria.
b, Representative kymographs. A line-scan of the mCherry signal (x axis, denoting mitochondrial position along an axon) is plotted against time (downwards, y axis, 5 minutes). For each axon imaged, 5min of data were acquired during each of the three phases illustrated above in (a).
c, Motility was analyzed for each kymograph in (b). Vertical yellow lines signify stationary mitochondria; diagonal lines signify mitochondria moving in the retrograde(blue) or anterograde (red) directions.
d, Quantification of motility profiles, plotting “% time spent in motion” for each direction for each of the three phases of the assay. (n=8 / 3 independent repeats; box-and-whisker plots display statistical median (center value), upper and lower quartiles (boxes), and max values (whiskers), source data in Sup. Table 1; Kif1a image adapted from 46)

