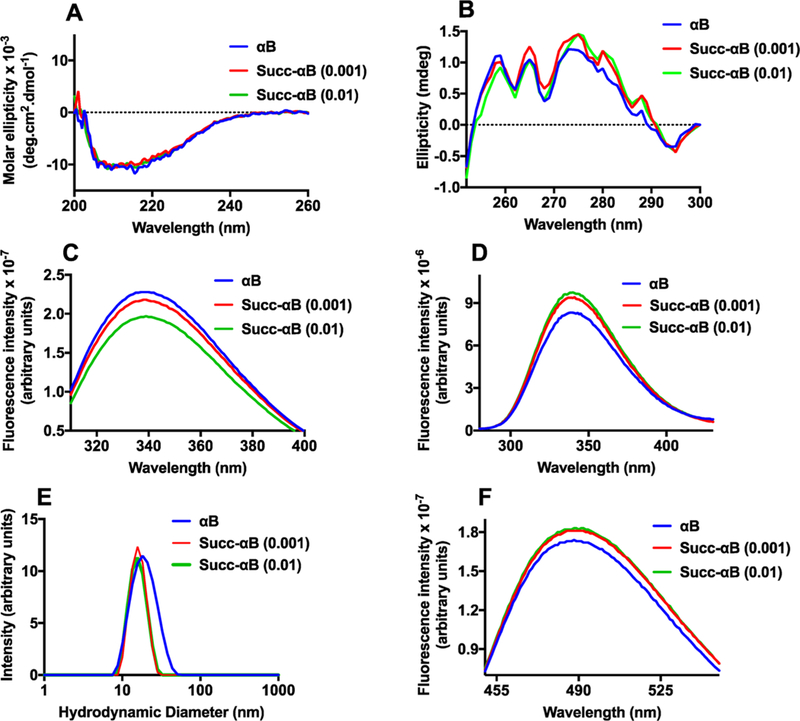
Figure 11.

The effect of succinylation on the conformation of αB. Far UV-CD spectra (A) and near UV-CD spectra of αB and Succ-αB (B). Tryptophan fluorescence spectra at the excitation wavelength of 295 nm (C). Phenylalanine fluorescence spectra at the excitation wavelength of 257 nm (D). The excitation and emission slit widths for the tryptophan and phenylalanine fluorescence spectra were 5 nm each. The protein concentration for both fluorescence spectra was 0.1 mg/mL in 50 mM phosphate buffer, pH 7.4. The intensity particle size distribution spectra (E) of αB and Succ-αB αB (1 mg/mL) were recorded using dynamic light scattering at 25 °C in 50 mM phosphate buffer, pH 7.5. The spectra shown are the averages of 36 scans. The surface hydrophobicity of αB and succinylated αB was measured using bis-ANS (F); the excitation wavelength used was 390 nm.
