
Figure 5.
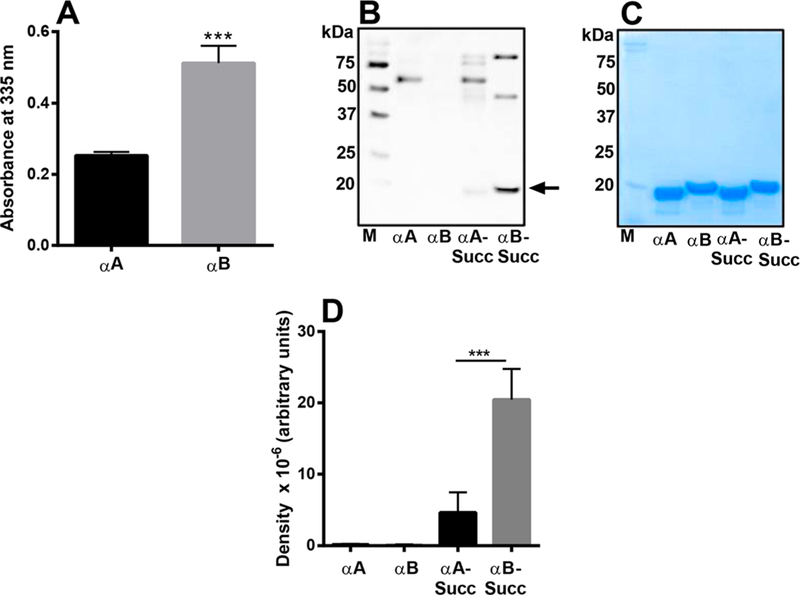
Comparison of reactive amino groups and SuccK levels in αA and αB succinylated in vitro. The TNBS assay determined the reactive amino groups in αA and αB (A). A Western blot of unsuccinylated and succinylated αA and αB (with 0.01 mM SuccCoA) was performed using a SuccK antibody (B). Coomassie blue staining of the gel (shown are after protein transfer) showed equal loading of the proteins in the samples (C). A densitometric plot for the Western blot is shown in panel D. The bar graphs indicate the means ± SD of triplicate measurements. M, molecular weight markers. ***p < 0.0005.