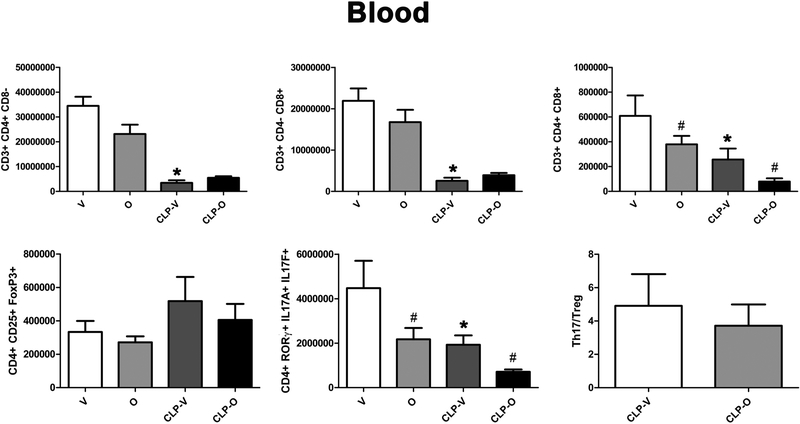
Figure 14. Effect of olaparib on the numbers of various T-cell populations in the blood of young male Balb/c mice subjected to CLP.
Values are shown in sham mice (not subjected to CLP, but treated with vehicle for 24 hours) (“V”), in sham mice (not subjected to CLP, but treated with 10 mg/kg olaparib for 24 hours) (“O”) in vehicle-treated mice subjected to CLP for 24 hours (“CLP-V”) and in mice subjected to CLP in the presence of 10 mg/kg olaparib (“CLP-O”). Data are shown as mean ± SEM of 10 animals for each group; *p<0.05 shows a significant change in the respective cell population in response to CLP, compared to the sham group; #p<0.05 shows significant effect of olaparib under non-CLP conditions (compared to vehicle-treated sham mice) or in CLP mice (compared to vehicle-treated CLP mice).

