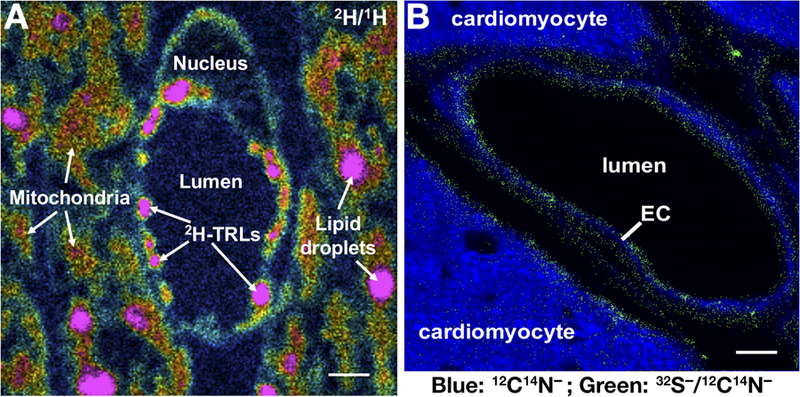
Figure 3. NanoSIMS imaging to examine intravascular lipolysis.

(A) 2H/1H ratio image of a capillary in a mouse heart 2 min after an intravenous injection of 2H-TRLs (triglyceride-rich lipoproteins enriched in 2H-triglycerides). The 2H/1H image shows 2H-TRLs that have marginated along the luminal surface of capillary endothelial cells and entry of 2H-enriched lipids into endothelial cells as well as the mitochondria and lipid droplets of cardiomyocytes. The 2H/1H ratio is multiplied by 10,000; the range spans from slightly higher than 2H natural abundance to approximately six times natural abundance. Scale bar, 1 µm. (B) Composite 12C14N− and 32S− /12C14N− images of mouse heart capillaries. The signal from 12C14N− secondary ions (blue), reflecting 14N distribution, was robust in both capillary endothelial cells (EC) and cardiomyocytes. The 32S− /12C14N− ratio (green) was set from 0.05 to 0.06. Pixels with a 32S− /12C14N− ratio above 0.05 are shown, revealing features rich in 32S, relative to 14N, on the surface of endothelial cells and cardiomyocytes. Scale bar, 1 µm.
