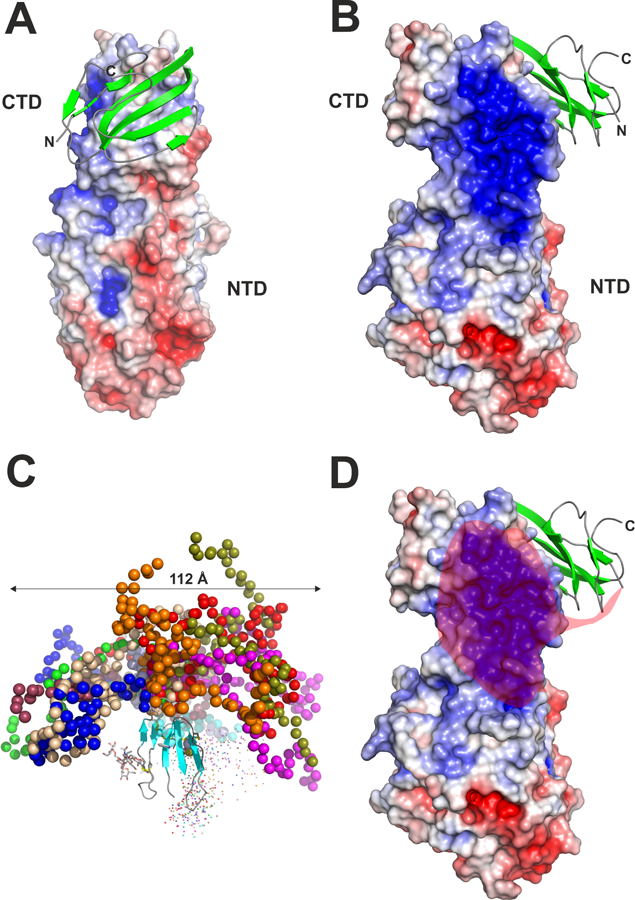
Figure 5. Three-dimensional structure of the human LPL–GPIHBP1 complex.

Panels A, B and D show the crystal structure of LPL as a surface representation colored by its electrostatic potential [acidic (red), neutral (white), basic (blue)] and human GPIHBP1 in a cartoon representation with β-strands colored green [modified from the crystal structure by Birrane and coworkers (Birrane et al., 2019)]. For clarity, only one of the two GPIHBP1–LPL complexes in the crystal structure is shown. The amino- and carboxyl-terminal regions of GPIHBP1 are marked by N and C, respectively. The positions of the amino- and carboxyl-terminal domains of LPL are marked with NTD and CTD, respectively. Panel C shows the model of GPIHBP1 in solution, as defined by SAXS analyses, illustrating the large space occupied by GPIHBP1’s intrinsically disordered acidic domain [modified from (Kristensen et al., 2018)]. Different ensembles from the modeling of the disordered acidic domain are illustrated by colored spheres, while the folded LU domain is represented by a cartoon representation. The acidic domain of GPIHBP1 is absent in panels A and B, as it was not defined by electron densities. The semi-transparent red “cloud” in Panel D illustrates the region of LPL that is potentially engaged by GPIHBP1’s intrinsically disordered acidic domain in a “fuzzy complex.”
