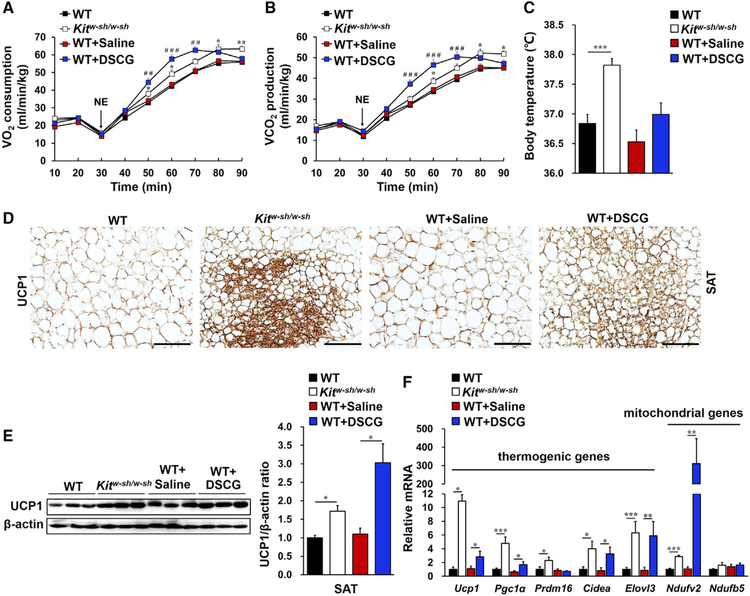
Figure 1. MCs Controlled Systemic Energy Expenditure and SAT Thermogenesis and Browning in Mice on a Chow Diet.
(A and B) NE-stimulated mouse metabolic rate, including oxygen consumption (VO2; A) and carbon dioxide production (VCO2; B) in WT mice (n = 13), Kitw-sh/w-sh mice (n = 13), WT mice receiving saline (WT+Saline, n = 13) or DSCG (WT+DSCG, n = 16) intraperitoneal (i.p.) injections.
(C) Core body temperatures for the indicated groups of mice.
(D) UCP1 immunostaining of representative SAT sections (n = 8 per group); scale bars, 100 µm.
(E) Immunoblot analysis and quantification of UCP1 relative to β-actin in SAT (n = 6 per group).
(F) Real-time PCR analysis of thermogenic and mitochondrial genes in SAT (n = 8~13 per group).
Data are mean ± SEM. *p < 0.05, **p < 0.01, ***p < 0.001.

